At a glance
- In 2024, 1.88 million (45.7%) Queensland adults and 620,000 (69.3%) Queensland children met the recommendation for daily fruit consumption.
- In 2024, 241,000 (5.8%) Queensland adults and 27,000 (3.1%) Queensland children met the recommendation for daily vegetable consumption.
- The proportion of Queenslanders consuming the recommended daily serves of vegetables continues to fall. In adults, it decreased by 35.9% from 2005 to 2024, and in children it decreased by 51.5% from 2013 to 2024.
Introduction
A healthy diet is essential for adequate growth, to maintain a healthy weight, achieve optimal mental and physical health, fight infection and protect against chronic diseases such as type 2 diabetes, cardiovascular disease and some types of cancer. According to the Australian dietary guidelines, the healthiest diets include a wide variety of healthy and nutritious foods from the five food groups every day, and drinking plenty of water.1 Environmental, behavioural, biological, societal and genetic factors all impact on the ability to achieve a healthy diet and prevent and manage diet-related health conditions.
Most fruit and vegetables, including legumes and beans, are nutrient dense, are low in kilojoules, and are a good source of minerals and vitamins (such as magnesium, vitamin C and folate), dietary fibre and a range of phytochemicals including carotenoids. The Australian dietary guidelines and the Australian guide to healthy eating were updated in 2013. Funding for the next review was announced in 2020 to ensure they are based on the latest evidence and expert opinion.
Serves per day
| 19-50 years | 51-70 years | 70+ years | |
|---|---|---|---|
| Men | 2 | 2 | 2 |
| Women | 2 | 2 | 2 |
| 2-3 years | 4-8 years | 9-11 years | 12-13 years | 14-18 years | |
|---|---|---|---|---|---|
| Boys | 1 | 1 1/2 | 2 | 2 | 2 |
| Girls | 1 | 1 1/2 | 2 | 2 | 2 |
Serves per day
| 19-50 years | 51-70 years | 70+ years | |
|---|---|---|---|
| Men | 6 | 5 1/2 | 5 |
| Women | 5 | 5 | 5 |
| 2-3 years | 4-8 years | 9-11 years | 12-13 years | 14-18 years | |
|---|---|---|---|---|---|
| Boys | 2 1/2 | 4 1/2 | 5 | 5 1/2 | 5 1/2 |
| Girls | 2 1/2 | 4 1/2 | 5 | 5 | 5 |
Most Queenslanders do not meet recommended dietary patterns.2 Individuals and society more broadly, are negatively affected by poor nutrition:
- In 2024, combined dietary risks accounted for 4.8% of the total burden of disease (DALY).3
- Considering dietary risks combined, the highest proportions of disease-specific burden attributable to dietary risks were for coronary heart disease (49.9% of burden) followed by bowel cancer (26.1%) and type 2 diabetes mellitus (26.0%).3 Results for all the conditions linked to dietary risks are available in the Burden of Disease section of this report.
- In 2018–19, total Australian health system expenditure attributable to dietary risks was estimated to be $1.180 billion.4
Latest results
Adults
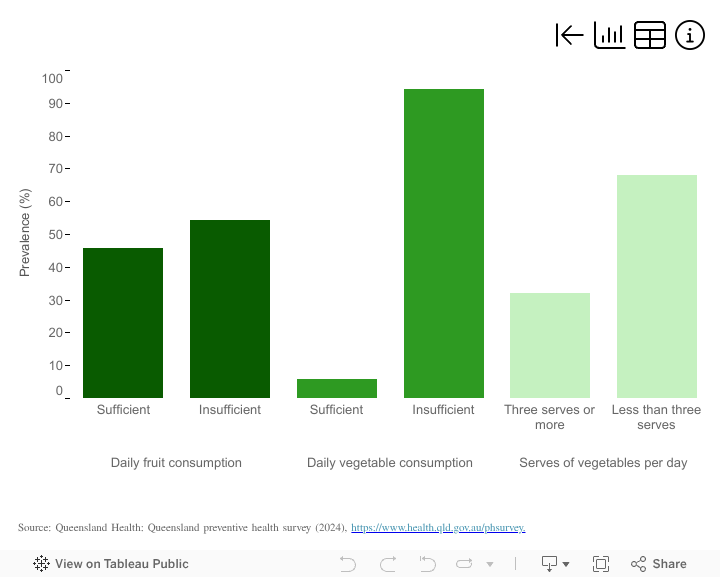
In 2024, 45.7% of Queensland adults ate the recommended serves of fruit each day.
Comparing adult Queenslanders across sociodemographic groups showed consuming the recommended daily serves of fruit was (Figure 1):
- 14.4% more likely among females than males (48.7% and 42.5%, respectively)
- 24.5% more likely among adults 65 years and older than adults 18 to 29 years
- 10.7% more likely among adults living in the most advantaged socioeconomic areas compared to those living in the most disadvantaged socioeconomic areas.
The proportion of adult Queenslanders meeting fruit consumption recommendations was similar across remoteness areas.
In 2024, 5.8% of Queensland adults consumed the recommended serves of vegetables daily, while 32.1% ate three or more serves of vegetables a day.
Comparing adult Queenslanders across sociodemographic groups showed consuming the recommended daily serves of vegetables was (Figure 1):
- 2.7 times more likely among females than males (8.5% and 3.1%, respectively)
- 60.2% more likely among adults 65 years or more than adults 18 to 29 years.
The proportion of Queensland adults meeting daily vegetable consumption guidelines was similar across socioeconomic groups and remoteness areas (Figure 1).5
Figure 1: Adult consumption of fruit and vegetables in Queensland, 2024
If dashboard does not load, view the dashboard in Tableau.
Making Healthy Happen 2032 is the Queensland Government’s strategy to prevent, reduce and treat obesity in Queensland. Actions are addressing poor nutrition, physical inactivity and health inequities to shift the causes of obesity, which are mostly beyond an individual’s control.
Children
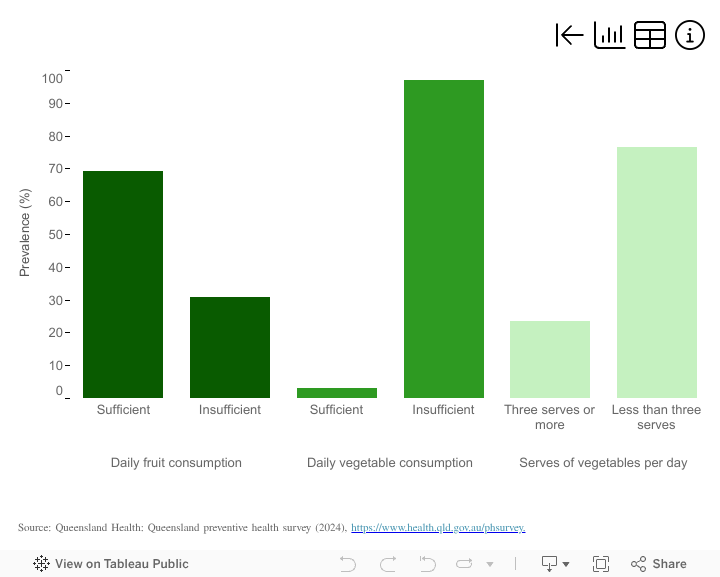
In 2024, 69.3% of Queensland children ate the recommended number of serves of fruit each day. Comparing Queensland children across sociodemographic groups showed consuming the recommended serves of fruit daily was (Figure 2):
- 10.3% more likely among girls than boys (72.7% and 66.0%, respectively)
- 45.0% more likely among children 5 to 11 years than children 12 to 17 years
- 17.1% more likely among children living in most advantaged areas than children living in the most disadvantaged areas.
The proportion of Queensland children meeting fruit consumption recommendations was similar across remoteness areas.
Very few Queensland children 5 to 17 years (3.1%) ate the recommended daily serves of vegetables, although about one-fifth of Queensland children (23.5%) ate three or more serves of vegetables per day. For Queensland children, vegetable consumption patterns were similar across sex, age, and socioeconomic and remoteness areas in 2024 (Figure 2).5
Figure 2: Child consumption of fruit and vegetables in Queensland, 2024
If dashboard does not load, view the dashboard in Tableau.
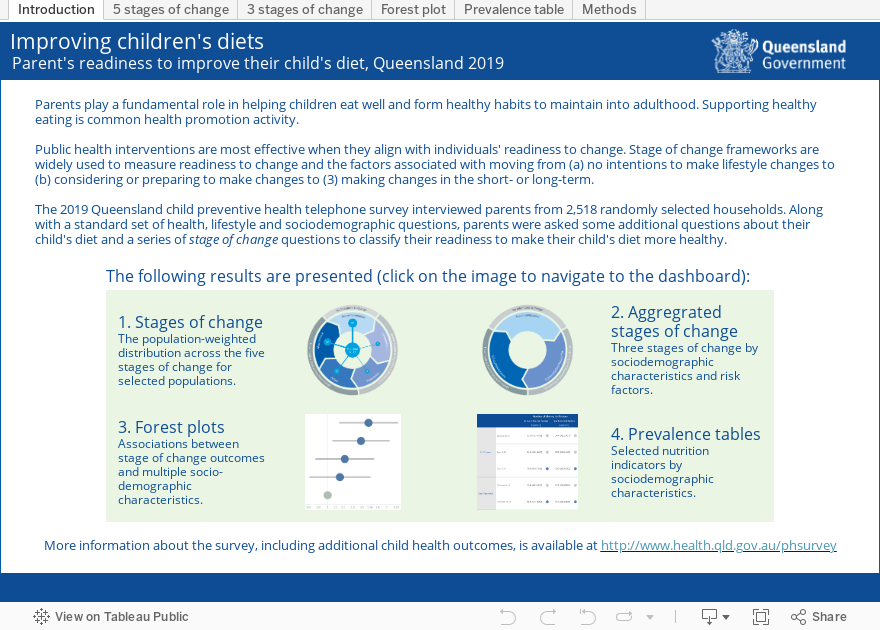
Parent's readiness to improve their child's diet
In 2019, parents participating in the Queensland preventive health survey were asked questions about current actions or intentions to make their child’s diet healthier. Overall, 39.1% of parents were currently taking action to make their child’s diet healthier, while 60.9% of parents were not. Almost half (46.8%) were not considering any action (Figure 3).
Concern about the child’s weight was a primary factor in parents taking or planning to take action to improve their child’s diet. Intentions to improve their child’s diet within the next year were positively associated with the child’s number of risky dietary behaviours.5
Figure 3: Parent readiness to make their child’s diet healthier in Queensland, 2019
This figure contains multiple interactive dashboards, which can be accessed using the tabs along the top or the icons in the green box.
If dashboard does not load, view the dashboard in Tableau.
Trends
Fruit consumption
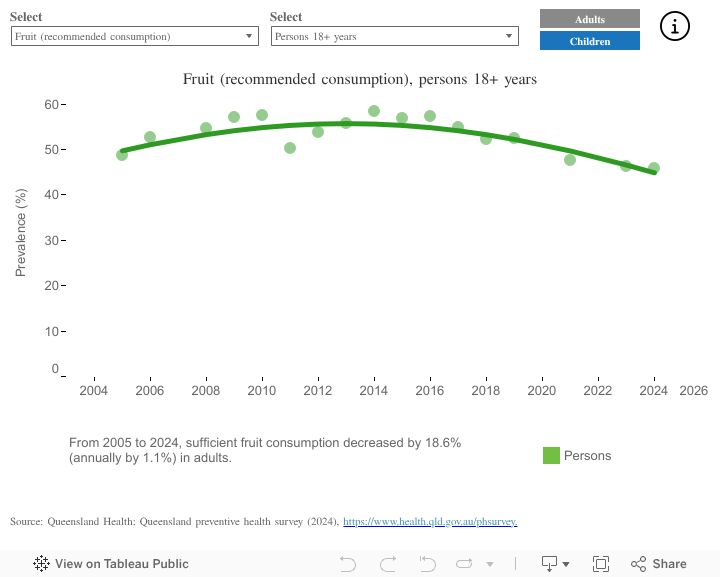
Fruit consumption at the recommended levels among Queensland adults and children is not improving.
From 2005 to 2024, the proportion of adults eating the recommended daily serves of fruit decreased by 18.6%. Decreases among adult Queenslanders were similar for males and females, and socioeconomic and remoteness areas. Decreases in the proportion of adults meeting the daily fruit consumption recommendation varied across adult age groups in Queensland, with greater declines in adults 45 to 64 years and adults 65 years and older than in the younger adult age groups.
From 2013 to 2024, the proportion of Queensland children meeting the fruit consumption guideline was stable overall and by sex, age, and socioeconomic and remoteness areas.5
Vegetable consumption
The proportions of adults and children in Queensland consuming sufficient vegetables continues to fall.
For Queensland adults, the proportion consuming the recommended daily serves of vegetables decreased by 35.9% from 2005 to 2024. Decreases in the proportion of adults meeting recommended vegetable consumption guidelines were similar for males and females, however, the decreases varied by other sociodemographic factors:
- Declines in sufficient vegetable consumption were greater for adults 45 years and older—in 2024 the proportion meeting recommended guidelines had almost reached that of adults 18 to 44 years.
- A greater decrease was observed in adults living in the most disadvantaged areas compared to those living in more advantaged areas (52.2% compared to no change, respectively).
- Declines were greater for adults in inner regional areas compared to major cities (46.2% and 28.3%, respectively).
For Queensland children 5 to 17 years, the proportion meeting the vegetable consumption guideline decreased by 51.5% from 2013 to 2024. Decreases in the proportion of Queensland children meeting the vegetable consumption guideline were similar for boys and girls, across age, and by socioeconomic and remoteness areas (Figure 4).5
Figure 4: Trends in consumption of fruit and vegetables, 2024
If dashboard does not load, view the dashboard in Tableau.
National comparisons
The National Health Survey (NHS), conducted by the Australian Bureau of Statistics, provides information on a range of health conditions and services including modifiable risk factors. Because the NHS uses different methodology, results will typically be similar, but not identical to those from the Queensland preventive health survey. National studies are used to understand how Queensland compares to other Australian jurisdictions. Because population distributions may differ across jurisdictions, age-standardised proportions that remove the effects of age are reported when available.
In 2022, the standardised proportion of adults consuming the recommended daily serves of fruit in Queensland was similar to Australia overall (41.5% and 43.4%, respectively). Queensland ranked 4th among other Australian states and territories for adult recommended fruit consumption. Among children, the standardised proportion of Queensland children 5 to 17 years meeting fruit consumption guidelines was 58.2%, similar to the standardised proportion for Australian children (58.1%). Queensland ranked 4th among other Australian states and territories for child recommended fruit consumption.
For vegetable consumption, the standardised proportion of Queensland adults consuming the recommended daily serves (5.0%) in 2022 was also similar to the Australian proportion (6.3%). Among the Australian states and territories, Queensland ranked 8th for adult recommended vegetable consumption. For Queensland children 5 to 17 years, the standardised proportion meeting vegetable consumption guidelines was 1.9%, however, this estimate had high variability and should be interpreted with caution. The Queensland proportion was similar to the proportion for Australian children (2.7%). Queensland ranked 7th among other Australian states and territories for child recommended vegetable consumption.6
Additional information
Data and statistics
Summary results from the Queensland preventive health survey (QPHS) for Hospital and Health Services and other regions can be found within this report and more detailed and historical results can be accessed at Queensland Preventive health surveys.
Strategies and information
For more information about nutrition and dietary guidelines visit:
- The National Health and Medical Research Council - Nutrition and Australian dietary guidelines
- The Department of Health and Aged Care - Australian National Breastfeeding Strategy: 2019 and beyond
- Health and Wellbeing Queensland
- Cancer Council Queensland - Healthy eating and drinking
- My health for life to take a personal health check and learn more about healthy lifestyles.
Section technical notes
Counts of people by modifiable risk factors are estimated by applying the indicator proportion to the relevant estimated resident population (ERP). More information about ERP is available from the Australian Bureau of Statistics National, state and territory population.
Where presented, ratios were calculated using higher precision estimates than in text. Ratios calculated using estimates in text may differ.
Data for this section were sourced from:
- Queensland preventive health survey (QPHS) (See Queensland Preventive health surveys for further information)
- Australian Bureau of Statistics National Health Survey 2022 (See Australian Bureau of Statistics National Health Survey 2022 for further information).
Figures on this page are interactive
To learn more about how to navigate interactive figures, dashboards, and visualisations see About this Report.
References
- National Health and Medical Research Council. 2013. The Australian Dietary Guidelines, Australian Government, Canberra, https://www.health.gov.au/resources/publications/the-australian-dietary-guidelines, accessed 4 October 2024.
- Queensland Health. 2018. Are Queenslanders meeting the Australian Dietary Guidelines? Daily diets and total energy intake, Department of Health, Queensland Government: Brisbane, https://www.health.qld.gov.au/__data/assets/pdf_file/0029/731198/diets-report-qld.pdf, accessed 4 October 2024.
- Australian Institute of Health and Welfare. 2024. Australian Burden of Disease Study 2024, https://www.aihw.gov.au/reports/burden-of-disease/australian-burden-of-disease-study-2024/contents/about, accessed 12 December 2024.
- Australian Institute of Health and Welfare. 2024. Health system spending per case of disease and for certain risk factors, https://www.aihw.gov.au/reports/health-welfare-expenditure/health-system-spending-per-case-of-disease/contents/about, accessed 16 January 2025.
- Queensland Health Queensland preventive health survey, https://www.health.qld.gov.au/research-reports/population-health/preventive-health-surveys/about.
- Australian Bureau of Statistics. 2023. National Health Survey (NHS) 2022, https://www.abs.gov.au/statistics/health/health-conditions-and-risks/national-health-survey/latest-release, accessed 14 November 2024.