At a glance
- Estimated life expectancy for people born in Queensland in 2021–2023 was 80.5 years for males and 84.7 years for females. This was 3.6 years longer (males) and 2.4 years longer (females) than those born in 1999–2001.
- From the high in 2019–2021, life expectancy decreased in 2021–2023 by 0.2 years in males and 0.3 years in females , while Queensland saw declines of 0.4 years for males and females.
- Nationally, males and females born in 2024 could expect to live an average of 88% and 86% of their lives in full health, respectively. For Queenslanders born in 2018, an expected 88.3% (males) and 86.9% (females) of their lives would be in full health.
- While the majority (82.3%) of adult Queenslanders continued to rate their health as excellent, very good or good in 2024, the number of unhealthy days in the past 30 has increased by 24.4% (1.6 days) from 2018 to 2024. Females 18 to 29 years reported the largest increase.
Introduction
This section includes summary health measures that are used internationally to monitor population health status.
- Life expectancy which is estimated from death rates and expressed as years of life remaining from a specific age—typically at birth or at age 65.
- Health and quality adjusted life expectancy which extend the concept of life expectancy to the expected years of life lived in full health. Two methods are presented—one based on disability-adjusted life years and the second based on people’s ratings of their own health across five physical and mental dimensions.
- Self-rated health—one of the most frequently used measures in health and social research.
- A measure of health-related quality of life (HRQoL) which is a multidimensional concept that refers to how people affect or are affected by health.
Life expectancy
Life expectancy measures the number of years a person born today can expect to live based on the current mortality statistics. Australian life expectancy ranks highly among the Organisation for Economic Co-operation and Development (OECD) countries. Based on OECD data, Australia ranked 3rd in 2022 among the participating countries (Figure 1).1,2 Queensland males would rank 9th and females would rank 8th if Queensland was an OECD country.
Figure 1: Queensland life expectancy compared to OECD countries
In 2021–2023, Queensland male life expectancy at birth reached 80.5 years, increasing from 76.9 in 1999–2001. Female life expectancy increased from 82.3 to 84.7 years during the same period.1
This was similar to Australian life expectancy at birth with males increasing to 81.1 years in 2021–2023 from 77.0 years in 1999–2001 and female life expectancy increasing to 85.1 from 82.4 years over the same period. Queensland life expectancy ranked 6th among the eight states and territories in 2021–2023 for males and 6th for females.3
Figure 2: Life expectancy by state and territory, 2021–2023
Trends
Due to the COVID-19 pandemic, a number of countries observed a reduction in their life expectancy.4–6 The Global Burden of Disease study estimated life expectancy and excess mortality for 204 countries from 1950 to 2021.6 Globally, age-standardised all cause mortality rates declined by 62.8% between 1950 and 2019. During the 2020–21 COVID-19 period, however, it increased by 5.1%. Similarly, global life expectancy at birth increased by 22.7 years to 71.7 years (69.0 years for males and 74.8 years for females). Global life expectancy then declined by 1.6 years between 2019 and 2021.
Reductions in life expectancy were driven by excess mortality, estimated at 1.04 deaths per 1,000 persons globally in 2020–21. Australia was one of only 20 countries to record fewer deaths than expected in 2020 or 2021 with 3 fewer deaths per 1,000 people in 2020 followed by an increase to 4 excess deaths per 1,000 people in 2021.6
Australia and Queensland also saw recent declines in life expectancy (Figure 3), however, declines were notably smaller than those observed globally. From the high in 2019–2021, Australian life expectancy has decreased by 0.2 years in males 0.3 years in females, while Queensland saw declines of 0.4 and 0.4 years, respectively.1,3 Estimated increases in all cause excess mortality in Australia during the COVID-19 pandemic were 1.6% (2021), 11.7% (2022) and 5.1% (2023) following a 3.1% reduction in 2020. Queensland saw increases of 1.1%, 10.6% and 4.6%, respectively, following a 2020 4.3% reduction in all cause mortality.7
Figure 3: Trends in life expectancy, Queensland and Australia
Health and quality adjusted life expectancy
While life expectancy is useful to compare across time and regions, it provides a limited picture of the population health. For example, it does not differentiate between those that are well and those that are not in optimum health.
Health-adjusted life years combine mortality and morbidity information to extend the concept of life expectancy by estimating the amount of time a person can expect to spend in a healthy state during their life course.8 Health-adjusted life expectancy (HALE) and quality-adjusted life expectancy (QALE) are two such measures.
Health-adjusted life expectancy
HALE provides the time an individual at a specified age (typically at birth or at age 65 years) could expect to live in full health without disease or injury. HALE is calculated as part of the Australian Burden of Disease Study (ABDS) and combines morbidity and mortality information with disability weights developed by expert opinion. The most recent national ABDS results are from 20249 while the most recent results for Queensland and by remoteness and socioeconomic status are from 2018.10 As explained for Burden of disease, results are not comparable across different ABDS studies.
- For Queenslanders born in 2018, approximately 88.3% (males) and 86.9% (females) of years lived were expected to be in full health, similar to all Australians born in 2018.10
- HALE for Queensland males and females born in 2018 was 70.7 and 73.6 years, respectively. This is 10 years (males) and 11.4 years (females) less than life expectancy.10
- Nationally in 2024, HALE at birth was 71.7 and 73.8 for males and females, respectively. This was 9.9 years (males) and 11.7 years (females) less than life expectancy.9
- HALE increased between 2003 and 2024 nationally and males experienced the greatest gains. On average those born in 2024 could expect to live 2.3 more years in full health than those born in 2003 (males) and 1.0 more year in full health than those born in 2003 (females).9
- Queenslanders age 65 years in 2018 could expect, on average, three-quarters of their remaining life to be lived in full health 74.8% for males and 72.7% for females.10
Remoteness and socioeconomic differences
- HALE at birth for Australians living in remote and very remote areas was 5.1 and 5.2 years shorter than those living in major cities in 2018 for males and females, respectively.10
- HALE at birth for Australian males and females in 2018 living in the most socioeconomically disadvantaged areas was 6.8 and 5.9 years shorter, respectively, than for those in the least disadvantaged areas.10
Quality-adjusted life expectancy
QALE is similar to HALE in that both measures estimate the amount of time that people live in perfect or sub-optimal health states. HALE, however, uses health condition-specific disability measures while QALE is based on people’s ratings of their own health across five physical and mental dimensions.11,12 The underlying health utility measures used in QALE can also be used for health economics studies.
The 2022 and 2023 Queensland preventive health surveys13 were combined to calculate health states by sociodemographic factors.14 Based on the QALE approach, the average time spent in optimal health for the Queensland population was estimated to be 74.6 (males) and 77.1 (female) years. This compares with 80.7 and 85.0 years for life expectancy for males and females in 2020–2022, respectively.
QALE was also estimated in a hypothetical population in which a modifiable risk factor was absent. This provides a measure of the average population-level years of perfect health that would be gained if a risk factor was removed. Results should not be interpreted as gains to an individual’s health, because the effects of the subset of individuals with the risk factor are averaged across the population.
On average from birth, if the entire population (Figure 4):
- was a healthy weight, males would gain 1.8 years living in optimum health (measured in quality-adjusted life years; QALYs) while females would gain 2.6 years living in optimum health, representing a 2.4% and 3.4% improvement to QALE
- had never smoked, males would gain 2.5 years living in optimum health and females would gain 1.8 years living in optimum health, representing a 3.4% and 2.3% improvement to QALE
- ate the recommended serves of fruit, 0.7 (males) and 0.8 (females) of a year living in optimum health would be gained, representing a 0.9% and 1.0% improvement to QALE
- ate the recommended serves of vegetables, 1.0 year living in optimum health would be gained for both males and females, representing a 1.3% improvement to QALE.
It is important to note that the relationship between modifiable risk factors and health utility scores are not causal. For example, lower health-related quality of life (HRQoL) among smokers may not necessarily be because they smoke cigarettes, but rather, the combination of smoking and other lifestyle characteristics in that subgroup that may impact their health status.14
Figure 4: Quality-adjusted life expectancy in the current and hypothetical Queensland population, 2020–2022
A component of sustainable health care delivery is that gains in life expectancy are accompanied by commensurate extensions to years lived in good health. QALY gains for populations practising healthy lifestyle behaviours indicate additional years of good health with hypothetically reduced healthcare expenditure. Results demonstrate relative gains at the population-level and wider health system in addressing modifiable risk factors.
Self-rated health
Self-rated health (SRH) is associated with mortality, treatment outcomes, and future functional ability. These relationships vary by age, gender, social class, health status, country and culture and have been associated with mortality and health care utilisation.15,16
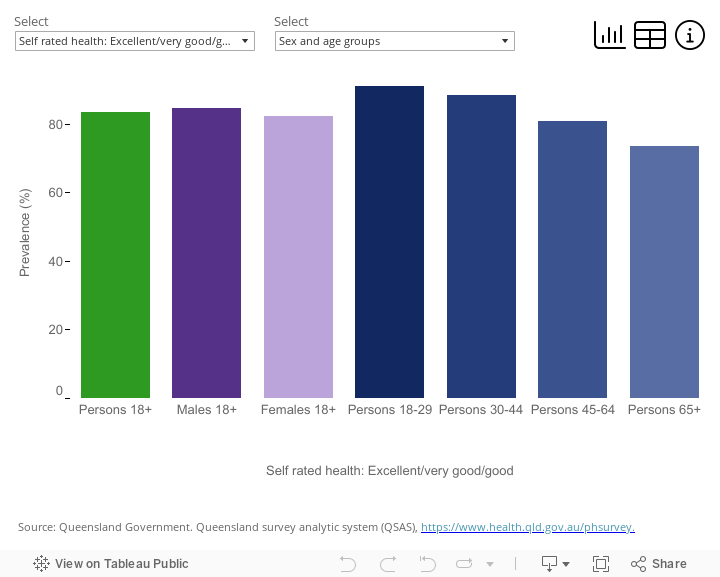
- In 2024, 82.3% of Queensland adults rated their health as excellent, very good or good. Results were similar for males (82.2%) and females (82.5%).
- Generally, younger Queenslanders rated their health more favourably than older people. While 88.3% of 18 to 29 year olds reported that their health was excellent, very good or good, this reduced to 73.1% for adults 65 years and over.
- Regional differences were evident with a larger percentage of adults living in the most socioeconomically advantaged areas rating their health positively (89.3%) compared to those living in the most disadvantaged areas (75.1%) (Figure 5).
The prevalence of Queensland adults who rated their health as excellent, very good, or good has remained largely stable over time—varying from 82.6% to 82.3% over the period 2004 and 2024 (data not shown).
Figure 5: Self-rated health for Queensland adults, 2024
If the dashboard does not load, view the dashboard in Tableau.
Healthy days
The Healthy Days instrument, developed by the US Centers of Disease Control, is one of the many measures of HRQoL. This instrument asks how many days over the past 30 that people experienced poor physical and mental health status. It also asks whether this limited their ability to do usual activities.17
The number of unhealthy days is an easily interpreted metric for policy applications. Healthy days results have proved useful for monitoring population health and understanding demographic and socioeconomic disparities, burden of illness and disability, and relationship between health and modifiable risk factors.18–21 In Queensland, it has been associated with sociodemographic factors, modifiable risk factors and population-level hospital utilisation.22
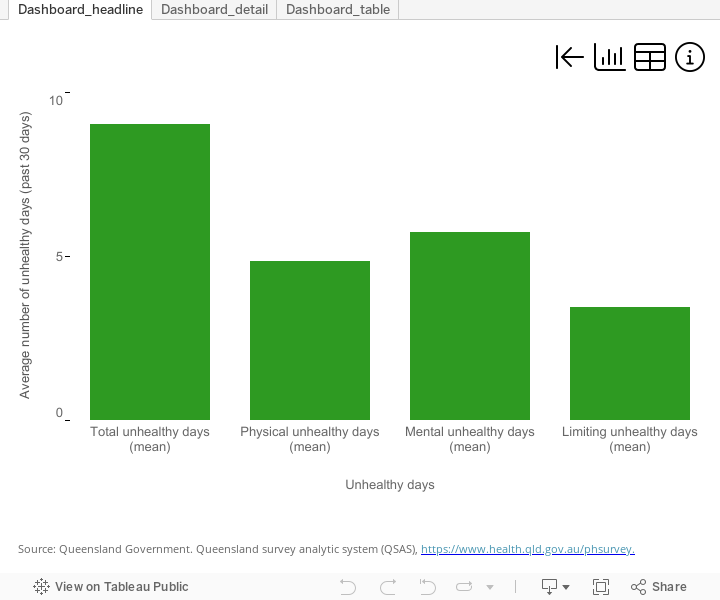
In Queensland, this measure is regularly collected on the Queensland preventive health survey.13 In 2024, over the past 30 days Queensland adults averaged:
- 9.3 total unhealthy days
- 5.2 physically unhealthy days
- 5.6 mentally unhealthy days (Figure 6).
Mentally unhealthy days are discussed in the Mental Health section of this report. Sociodemographic differences in other unhealthy days measures are presented below.
In 2024, over the past 30 days Queensland adult:
- females averaged 2.6 more unhealthy days than males (10.5 days compared to 7.9 days)
- females 18 to 29 years had the highest number of unhealthy days (12.5 days), 4.9 days higher than their male peers
- adults in the most disadvantaged areas reported 2.5 more unhealthy days than those in the most advantaged areas and had 1.6 more unhealthy days that limited their usual activities.
Figure 6: Average number of unhealthy days for Queensland adults, 2024
If the dashboard does not load, view the dashboard in Tableau.
The number of unhealthy days that adults report is increasing for both males and females. Based on trend analysis, the number of unhealthy days from 2018 to 2024:
- increased by 24.4% (1.6 days) over the entire period (19.4% for males and 27.3% for females)
- that limited usual activities increased by 41.9% over the period (38.7% for males and 45.1% for females)
Figure 7: Trends in Queensland unhealthy days
The increase, however, varied by sex. Females 18 to 29 years showed a particular increase in unhealthy days (35.5% over the entire period), compared to their male peers (25.1% over the entire period) (Figure 8).
Increases in young females were particularly evident in mentally unhealthy days—for further analyses on this indicator, please see the Mental Health section of this report.
Figure 8: Trends in Queensland unhealthy days by age and sex
Additional information
Data and statistics
Additional information for self-rated health and healthy days measures is available from Queensland Health’s Preventive health surveys webpage. This includes regional results (Hospital and Health Services and local government areas) as well as results from past surveys.
Visit the AIHW’s Burden of Disease page for more information about HALE.
Section technical notes
See the About this Report section of this report for trend analysis methods. In text, results are presented as the total increase or decrease over the specified time period. In graph hover boxes, the annual percentage change (APC) and 95% confidence intervals are presented. The APC is the average change per year over the time period.
Figures on this page are interactive
To learn more about how to navigate interactive figures, dashboards, and visualisations, see About this Report.
References
- Queensland Government Statistician’s Office. 2024. Life expectancy at birth (years) by sex, Queensland and Australia, 1881–1890 to 2021–2023, https://www.qgso.qld.gov.au/statistics/theme/population/vital-statistics/life-expectancy, accessed 8 November 2024.
- OECD Life expectancy at birth, doi:10.1787/27e0fc9d-en, accessed 18 March 2025.
- Australian Bureau of Statistics. 2024. Life Tables, 2021-2023, https://www.abs.gov.au/statistics/people/population/life-expectancy/2021-2023, accessed 8 November 2024.
- Kuehn BM. 2022. COVID-19 Cuts Life Expectancy in Dozens of Countries, JAMA, 327(3):209, doi:10.1001/jama.2021.24595.
- Woolf SH, Masters RK and Aron LY. 2021. Effect of the covid-19 pandemic in 2020 on life expectancy across populations in the USA and other high income countries: simulations of provisional mortality data, BMJn1343, doi:10.1136/bmj.n1343.
- Schumacher AE, Kyu HH, Aali A, et al. 2024. Global age-sex-specific mortality, life expectancy, and population estimates in 204 countries and territories and 811 subnational locations, 1950–2021, and the impact of the COVID-19 pandemic: a comprehensive demographic analysis for the Global Burden of Disease Study 2021, The LancetS0140673624004768, doi:10.1016/S0140-6736(24)00476-8.
- Australian Bureau of Statistics. 2024. Measuring Australia’s excess mortality during the COVID-19 pandemic until December 2023, Canberra, https://www.abs.gov.au/articles/measuring-australias-excess-mortality-during-covid-19-pandemic-until-december-2023#weekly-all-cause-mortality-australia, accessed 17 November 2024.
- Gold MR, Stevenson D and Fryback DG. 2002. HALYs and QALYs and DALYs, Oh My: Similarities and differences in summary measures of population health, Annual Review of Public Health, 23:115–134, doi:10.1146/annurev.publhealth.23.100901.140513.
- Australian Institute of Health and Welfare. 2024. Australian Burden of Disease Study 2024, https://www.aihw.gov.au/reports/burden-of-disease/australian-burden-of-disease-study-2024/contents/about, accessed 12 December 2024.
- Australian Institute of Health and Welfare. 2021. Australian Burden of Disease Study: Impact and causes of illness and death in Australia 2018, doi:10.25816/5PS1-J259.
- Jia H, Zack MM and Thompson WW. 2013. The Effects of Diabetes, Hypertension, Asthma, Heart Disease, and Stroke on Quality-Adjusted Life Expectancy, Value in Health, 16(1):140–147, doi:10.1016/j.jval.2012.08.2208.
- Höhn A, Lomax N, Rice H, et al. 2024. Estimating quality-adjusted life expectancy (QALE) for local authorities in Great Britain and its association with indicators of the inclusive economy: a cross-sectional study, BMJ Open, 14(3):e076704, doi:10.1136/bmjopen-2023-076704.
- Queensland Health. 2024. Queensland preventive health survey, https://www.health.qld.gov.au/research-reports/population-health/preventive-health-surveys/about, accessed 10 September 2024.
- Endo T, Lee XJ and Clemens SL. 2024. EQ-5D-5L Population Norms and Quality-Adjusted Life Expectancy by Sociodemographic Characteristics and Modifiable Risk Factors for Adults in Queensland, Australia, Value in Health, 27(5):633–641, doi:10.1016/j.jval.2024.02.007.
- Jylhä M. 2009. What is self-rated health and why does it predict mortality? Towards a unified conceptual model, Social Science & Medicine, 69(3):307–316, doi:10.1016/j.socscimed.2009.05.013.
- Xu F and Johnston JM. 2015. Self-Rated Health and Health Service Utilization: A Systematic Review., International Journal of Epidemiology, 44(suppl_1):i180–i180, doi:10.1093/ije/dyv096.267.
- Moriarty DG, Zack MM and Kobau R. 2003. The Centers for Disease Control and Prevention’s Healthy Days Measures - population tracking of perceived physical and mental health over time, Health and Quality of Life Outcomes, 1:37, doi:10.1186/1477-7525-1-37.
- Centers for Disease Control and Prevention. 2022. Health-Related Quality of Life (HRQOL), CDC Archive, https://archive.cdc.gov/www_cdc_gov/hrqol/index.htm#:~:text=Health-related quality of life (HRQOL) is an individual’s,role in public health practice.&text=How Are You Doing%3F, accessed 22 April 2024.
- Cordier T, Song Y, Cambon J, et al. 2018. A Bold Goal: More Healthy Days Through Improved Community Health, Population Health Management, 21(3):202–208, doi:10.1089/pop.2017.0142.
- Slabaugh SL, Shah M, Zack M, et al. 2017. Leveraging Health-Related Quality of Life in Population Health Management: The Case for Healthy Days, Population Health Management, 20(1):13–22, doi:10.1089/pop.2015.0162.
- Jia H, Zack MM and Thompson WW. 2016. Population-Based Estimates of Decreases in Quality-Adjusted Life Expectancy Associated with Unhealthy Body Mass Index, Public Health Reports®, 131(1):177–184, doi:10.1177/003335491613100125.
- Queensland Health. 2020. Health-related quality of life in Queensland: Relationship with risk factors and hospitalisations, Queensland Government, Brisbane, https://www.health.qld.gov.au/__data/assets/pdf_file/0024/1010778/uhd-risk-factors-hosp-2020.pdf, accessed 31 October 2022.