At a glance
- Population increases and ageing are estimated to increase hospitalisations to 3,878,000 by 2032–33, a 34.0% increase on hospitalisations recorded in 2022–23.
- Hospitalisations for conditions such as COPD and coronary heart disease are forecast to decrease over this period whereas hospitalisations for mental and behavioural disorders and injuries will increase, making up a higher proportion of all hospitalisations.
- The prevalence of daily smoking and insufficient physical activity will continue to fall through to 2032, however, overweight and obesity will likely continue to rise.
Introduction
The phrase ‘demography is destiny’ refers to how population size and composition impacts future prosperity, and is as true today as it was in the 19th century. In today’s society, it provides a useful lens to explore how population ageing may impact health service needs.
Ageing of the population
The Australian Bureau of Statistics (ABS) refers to generation cohorts using the following generational monikers:
- Interwar, born 1945 or earlier
- The Baby Boomer Generation, born 1946–1965
- Generation X, born 1966–1980
- Millennials (Generation Y), born 1981–1995
- Generation Z, born 1996–2010
- Generation Alpha, born 2011–2025.1
In 2021, Baby Boomers make up 21.5% of the Australian population, marginally greater in absolute terms than Millennials.2
Figure 1: Population size by birth cohort, Australia, 2021
Australia’s population has changed markedly in the past 30 years. In 1991, the median age was 32.4 years increasing to 38.4 years in 2021.3 Corresponding figures for Queensland are 31.8 years (1991) and 38.4 years (2021). Median age also varies geographically, ranging from 52.1 years in Hinchinbrook local government area to 24.5 years in Northern Peninsula Area in Queensland.4
The visualisation below shows how Queensland’s population has changed over the past approximately 50 years.
Figure 2: Changes in age distribution in Queensland population
Health care expenditure impacts due to population ageing
While much of the increased costs associated with an ageing population will be borne by the aged care sector, healthcare will also be impacted. Nationally, health, aged care and the National Disability Insurance Scheme are the top three fastest growing national government payments. National health spending is projected to increase from 2022–23 to 2062–63 from:
- 4.2% to 6.2% for GDP
- $4,000 to $8,677 for real spending per person.5
The ageing of the population is a main driver—the number of people 65 years and over is expected to more than double, and more than triple for those 85 years and over from 2022–23 to 2062–63. Currently, people in the 65 and over age group account for about 40% of health spending5 and demand for health services will increase as this cohort ages.
But these increases are not solely due to the ageing population—both age-specific and age-standardised rates have increased. From 1993–94 to 2019–20, national hospitalisation rates increased:6
- 39% for those under 65 years
- 72% for those 65 to 74 years
- 94% for those 75 years or older.
Figure 3 below shows how rates have changed in Queensland since 2002–03.
Figure 3: Changes in age-specific hospitalisation rates in Queensland
Exploring population ageing and healthcare impacts
Queensland hospitals
To explore how the ageing of the Queensland population could impact health care services, trend and projection analyses were conducted using the Queensland Hospital Admitted Patient Data Collection (QHAPDC). These projections are based on a set of assumptions and are not intended as exact forecasts but will give an indication of what might be expected if those assumptions were to apply over the projected time frame. Projections for the following conditions have been analysed:
- All cause hospitalisations
- All injuries
- Chronic obstructive pulmonary disease (COPD)
- Coronary heart disease (CHD)
- Dementia
- Diabetes (type 1 and 2)
- Mental and behavioural disorders
- Stroke
- 7-lifestyle-related chronic conditions—a combined group of 7 preventable chronic conditions: CHD, stroke, lung cancer, colorectal cancer, breast cancer, COPD and diabetes.
- Person awaiting admission to residential aged care service
- Chapter Z of The International Statistical Classification of Diseases and Health Related Problems, 10th Revision, Australian Modification (ICD-10-AM): Factors influencing health status and contact with the health system.
Inpatients waiting on placement to a residential aged care facility have been widely acknowledged to cause significant bottlenecks in the hospital system due to commonly longer lengths of stay.7 The ICD-10-AM code of Z75.11 Person awaiting admission to residential aged care service attempts to quantify these episodes.
The biggest contributor to all cause hospitalisations is ICD-10-AM chapter Z, Factors influencing health status and contact with health services. Chapter Z identifies why the patient is receiving services when a disease or disorder is not the reason the services were needed.
Modifiable risk factors
Modifiable risk factors are associated with several of these conditions and trend and projection analyses are used to forecast how these would change due to upcoming demographic shifts. The Queensland preventive health survey (QPHS) risk factors analysed were:
- daily smoking
- overweight and obesity
- obesity
- insufficient physical activity.
Methods summary
When trends in hospitalisation counts and prevalence of selected risk factors meet certain criteria, they can be projected—providing a reasonable estimate of the prevalence of these conditions into the future. Queensland Health uses the Acute Care Estimates (ACE) model for official health service projections.8 The ACE approach was broadly used for this exploration of ageing effects on hospitalisations, with analysis limited to episodes for Queensland residents only as is standard across this report. The period of historic data used to project trends was also aligned with the ACE method. Broadly, the approach was:
- Generate counts by age group for each condition and apply the appropriate estimated residential population (ERP).
- Conduct trend analysis to determine whether it’s appropriate to extrapolate into the future and, if so, apply population projections.
- Calculate a projected age-specific rate based on the historic trend using linear or Poisson regression, or 3-year weighted means depending on the conditions characteristics, or use Poisson for risk factors.
- Generate population level projected counts by applying age-specific rates to the population projections and then summing across age groups.
- Finally, calculate crude rates using the above results.
More detailed methods are available under Methods and technical notes.
Projected rates and counts over time
Hospitalisations
Figure 4 presents:
- actual numbers of hospitalisation for 2016–17 and 2022–23 and projected hospitalisations for 2026–27 and 2032–33 by condition
- percentage increases from 2022–23 for 2026–27 and 2032–33.
Overall, hospitalisations are estimated to increase by 34.0% from 2022–23 to 2032–33. A large component of this is due to increasing population and the increasing age of the population. Results for specific conditions show that from 2022–23 to 2032–33:
- the largest increases (81.5%) will be for dementia followed by Waiting for aged care placement (74.4%)
- conditions estimated to decrease over time are CHD (20.1% decline) and COPD (40.2% decline) and the group of 7-lifestyle conditions (9.9% decline).
Figure 4: Projected hospitalisations by year and cause and percent change to 2032–33
Changes in proportion of total hospitalisations
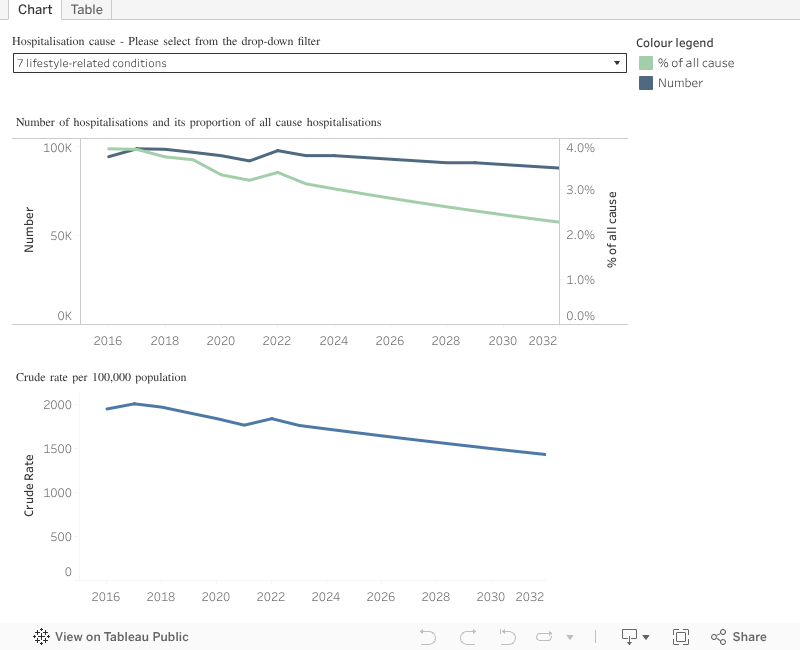
The proportion of total hospitalisations explores the future makeup of hospitalisations by condition. For example, some conditions may make up proportionally more of total hospitalisations over time where other conditions may decline. Figure 5 shows changes from 2016–17 to 2032–33 for:
- the number of hospitalisations and the proportion of all cause hospitalisation
- the crude hospitalisation rate.
Using the filter to select specific hospitalisation causes, for example, estimated changes from 2022–23 to 2032–33 are:
- Factors influencing health status increases from 24.9% to 25.9% of all cause hospitalisations, which increases the number of hospitalisations from approximately 721,000 to 1,004,000 and the rate from 13,542 to 16,296 per 100,000
- Waiting for placement to aged care is estimated to increase from 0.3% to 0.4% of all cause hospitalisations with episodes increasing from approximately 9,000 to 16,000
- CHD is estimated to decrease from 1.2% to 0.7% (approximately 33,000 to 27,000 episodes) while COPD is estimated to decrease from 0.6% to 0.3% (approximately 17,000 to 10,000 episodes).
Figure 5: Past and projected hospitalisation patterns by condition
If dashboard does not load, view the dashboard in Tableau.
Visualising the change over time by cohort
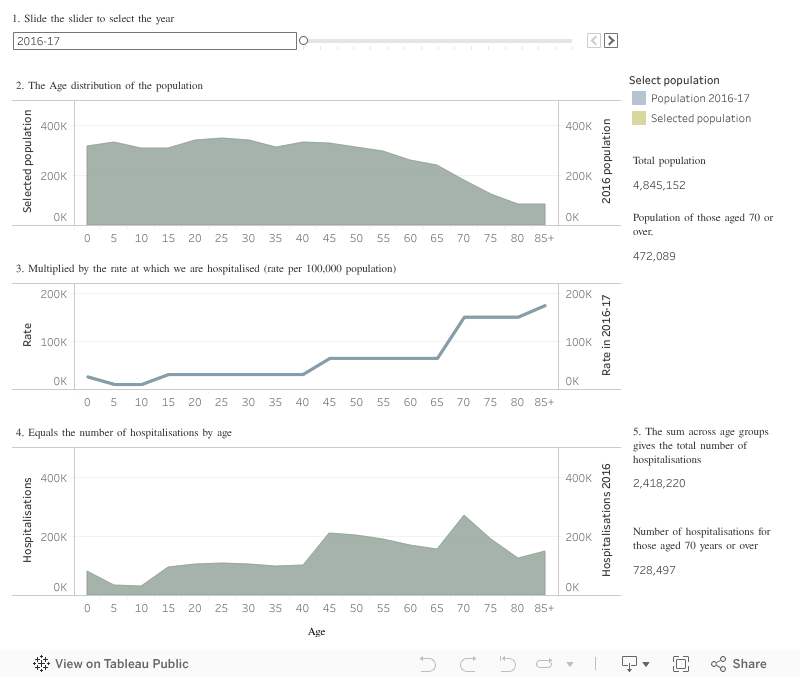
Figure 6 gives a good overview of how the relationship between the age-specific rates and population is estimated to impact hospitalisations. The increase in the older population with their higher age-specific rates has the biggest effect on hospitalisations.
The third area graph (panel 4) shows the estimated combined effects on the number of hospitalisations by age over time from:
- changes to the age distribution of the population (first area graph)
- increases in hospitalisation rates by age (second line graph).
By using the year slider, the population, rates and numbers of hospitalisations will change based on historic (to 2022–23) and projected (from 2023–24) results. The grey shading represents the initial 2016–17 time point while the tan shading shows the increase over time due to ageing of the population.
For example, in 2022–23:
- There were 629,567 adults 70 years and older, which includes 99,707 adults 85 years and over.
- Hospitalisation rates were 147,429 per 100,000, or nearly 1.5 per person, in those 70 to 84 years and 177,778 per 100,000, or 1.8 per person, in those 85 years and older.
- A total of 958,425 hospitalisations occurred for those 70 years and older, which includes 177,257 for those 85 years and older.
In 2032–33, this is estimated to increases to:
- A total of 911,451 adults 70 years and older, which includes 183,223 adults 85 years and over.
- Hospitalisation rates are estimated to be 143,334 per 100,000, or 1.4 per person, in those 70 to 84 years and 182,327 per 100,000, or 1.8 per person, in those 85 years and older.
- A total of 1,378,000 hospitalisation were estimated for those 70 years and over, which includes approximately 334,000 for those 85 years and older.
The gain in total hospital episodes from 2022–23 to 2032–33 is estimated to be almost 983,000 which includes almost 420,000 for those 70 years and older. Further, as more of the large Baby Boomer generation turns 70 years and over, when hospitalisation rates increase markedly, approximately 20 years of high hospitalisation demand is estimated.
Figure 6: Age distribution and the number of hospitalisations by year
If dashboard does not load, view the dashboard in Tableau.
Visualising the change over time by cohort
Figure 6 gives a good overview of how the relationship between the age-specific rates and population is estimated to impact hospitalisations. The increase in the older population with their higher age-specific rates has the biggest effect on hospitalisations.
The third area graph (panel 4) shows the estimated combined effects on the number of hospitalisations by age over time from:
- changes to the age distribution of the population (first area graph)
- increases in hospitalisation rates by age (second line graph).
By using the year slider, the population, rates and numbers of hospitalisations will change based on historic (to 2022–23) and projected (from 2023–24) results. The grey shading represents the initial 2016–17 time point while the tan shading shows the increase over time due to ageing of the population.
For example, in 2022–23:
- There were 629,567 adults 70 years and older, which includes 99,707 adults 85 years and over.
- Hospitalisation rates were 147,429 per 100,000, or nearly 1.5 per person, in those 70 to 84 years and 177,778 per 100,000, or 1.8 per person, in those 85 years and older.
- A total of 958,425 hospitalisations occurred for those 70 years and older, which includes 177,257 for those 85 years and older.
In 2032–33, this is estimated to increases to:
- A total of 911,451 adults 70 years and older, which includes 183,223 adults 85 years and over.
- Hospitalisation rates are estimated to be 143,334 per 100,000, or 1.4 per person, in those 70 to 84 years and 182,327 per 100,000, or 1.8 per person, in those 85 years and older.
- A total of 1,378,000 hospitalisation were estimated for those 70 years and over, which includes approximately 334,000 for those 85 years and older.
The gain in total hospital episodes from 2022–23 to 2032–33 is estimated to be almost 983,000 which includes almost 420,000 for those 70 years and older. Further, as more of the large Baby Boomer generation turns 70 years and over, when hospitalisation rates increase markedly, approximately 20 years of high hospitalisation demand is estimated.
Figure 7: Population of 65 to 84-year-old adults by year
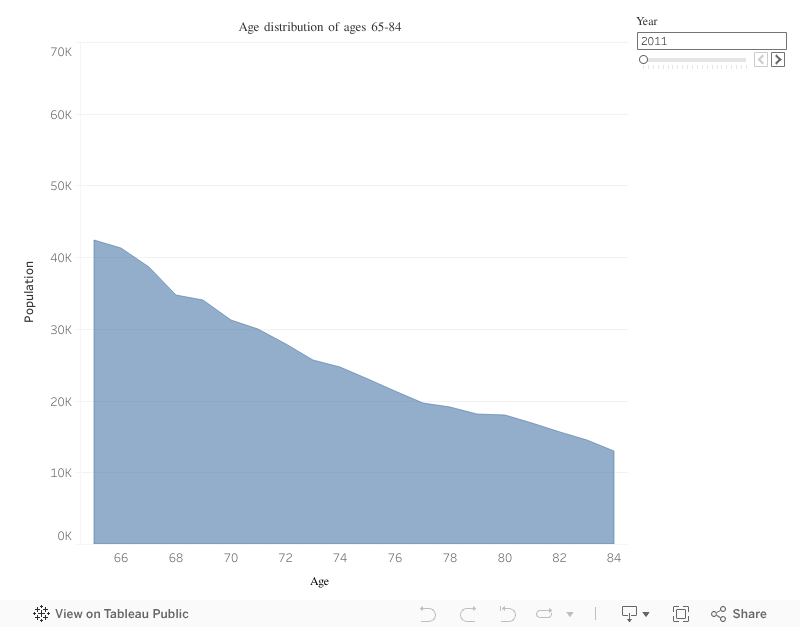
If dashboard does not load, view the dashboard in Tableau.
Modifiable risk factors
A similar approach can be used to estimate how risk factors will change over time. Changes in our work and leisure activities mean that different birth cohorts have different lifestyle exposures. For example, the global obesity epidemic is well documented and likely to increasingly impact the heath needs and outcomes of younger age groups as they age.
Figure 8 shows the actual (2024) and projected (2026 and 2032) results for:
- risk factor prevalence
- the number of adults with those risk factors
- the percentage change in prevalence since 2024
- the percentage change in the number of adults with those risk factors since 2024.
This series shows how the number of people with a risk factor will increase overall, even when the prevalence with the risk factor is decreasing, due to our growing total population size.
For example, even though the population prevalence of daily smoking has declined (from 8.9% to 8.6%, a 3.4% decline), the number of daily smokers increases from 2024 to 2026 (368,000 to 382,000 adults, respectively). This is magnified for conditions that are increasing in prevalence, such as self-reported obesity that is estimated to increase by 4.3% to 2026 resulting in an increase from 1,140,000 to 1,280,000 obese adults. Overweight and obesity will remain a concern into the future as 2-of-3 adults (66.8%) in Queensland are estimated to have this risk factor by 2032.
Figure 8: Changes in the prevalence and the number of adults with risk factors
Figure 9 shows similar information for modifiable risk factors as for Figure 5 in the hospitalisation section above.
Figure 9: Current and projected prevalence of modifiable risk factors

If dashboard does not load, view the dashboard in Tableau.
Health care costs by age cohort
The Australian Burden of Disease Study estimated that from 2003 to 2018 there was a 19.6% increase in total disease burden, of which 9.3% is due to population ageing.9 The growing ageing and overall growth of the population will increase overall healthcare costs, most notably for the later years lived in less than full health.
A 2018 study examined the fiscal impacts of ageing on health expenditure using increased life expectancy and increasing health care costs as people age. This study estimated that, based on ageing alone, costs for older adults, defined as over 65 years, would increase from $7,439 in 2015 to $9,594 per person by 2035.10 This increased total health expenditure from $166 billion to $320 billion nationally, based on an average annual growth of 3.33%. The study used health care expenditure per person in 2008–09, which increased by age. For example, respective costs for males and females for:
- 1-year-olds were $4,780 and $4,249
- 25-year-olds were $2,814 and $6,258
- 80-year-olds were $25,380 and $22,757.11
And while factors such as increasing demand for health services, increases in the complexity of health conditions, and funding new health technologies5 contribute to increases in health spending, key drivers are life expectancy and the number of years lived in full health. However, while health and medical advances have increased Australian lifespans, the gap between years lived in full health (the ‘healthspan’) and lifespan has increased in absolute terms (Figure 10),12 noting that healthspan is a population health concept and does not capture variability in health at an individual-level.
Figure 10: Trends in life expectancy at birth and years lived in full health
The later years of life are typically characterised by high health care costs that increase as death is approached. A risk of extending years of life lived without addressing years lived in poor health is that the period of higher health care costs due to ill health is increased. Extending age only is a scenario that can result in the highest health care costs, as demonstrated by the estimated increases of $7,439 in 2015 to $9,594 per person by 2035.10
The effects of addressing ill health on health care costs in later years can be estimated using different approaches as shown below.10
- One approach is to delay the onset of ill health as life expectancy increases. This keeps the total period of ill health constant by delaying morbidity onset by the same amount of time as the increase in life expectancy. This approach decreases costs per adult over age 65 from $6,951 to $5,994.
- A criticism of the above scenario is the assumption that all gains in life expectancy are for years in optimum health. It may be more reasonable to assume that a proportion of those additional years is also spent in poor health. Under that assumption, health care costs per adult over 65 year increased from $7,220 to $7,719.
While it is beyond the scope of this report to model how changes in risk factor prevalence may influence hospitalisation rates, numbers and costs, the potential contribution of addressing modifiable risk factors by extending years lived in full health is included in the Health-related quality of life section. Analyses showed that years lived in full health could be extended by 2.5 years (males) and 1.8 years (females) at a population-level if smoking was entirely absent from the population. Similar gains were observed for obesity with more modest, but nevertheless important, gains for fruit and vegetable consumption. Assuming that the compressed period lived in poor health translated to commensurate reductions in hospitalisations illustrates how addressing modifiable risk factors can contribute to wider health care sustainability.
Methods and technical notes
Projection process
The process to calculate projections uses the following steps:
- Obtain counts by age group for each selected condition.
- Apply the appropriate denominator to each condition from the relevant year ERP.
- Analyse the trend for each condition and age group to determine if it is appropriate to extrapolate this into the future.
- Obtain future population counts by age groups from the population projections file available from the Queensland Government Statistician’s Office (QGSO).
- Use Linear/Poisson regression or 3-year weighted mean depending on the condition’s characteristics to calculate a projected age-specific rate from the historic trend. Additional methodological information for Poisson regression for risk factors is available in the Trends in preventive health risk factors report.
- Calculate the future count of the condition by age group by applying the age-specific rate to the population projection.
- Sum across age groups to obtain a population level projected count of the condition.
- Calculate a crude rate based on the population projection.
Age groupings
Age groupings for hospitalisations include 0 to 4, 5 to 14, 15 to 44, 45 to 69, 70 to 84 and 85 and over. This aligns with age groupings used elsewhere in Queensland Health for hospitalisation projections.8 Stratifying older age groups was deemed important due to the inter-generational report highlighting the impact of the population 85 years and older into the future. This is also reflected in the growth of this age group in the QGSO population projections.5
Due to their low number, the following adjustments were made to age groups:
- dementia: those under 45 years excluded
- waiting for admission to aged care: those under 15 years excluded
- coronary heart disease: those under 15 years excluded.
Age groups for risk factors included 18 to 29, 30 to 44, 45 to 64 and 65 years and over. As the risk factor prevalence come from a stratified sampling frame, estimates for the over 85 age group may be based on a sample size that is too small for the purposes of projection, therefore estimates for the older population is limited to those 65 years and older.
Why don’t we use age-standardised rates?
Age-standardised rates are preferred when comparing disease outcomes between two populations with different age distributions. When these outcomes are compared using crude rates, the differences between the populations will likely be due to differing age structures, as age is by far the biggest predictor for poorer health outcomes. The age-standardisation process will convert observed disease outcomes to what would have been expected if an area had a “standard population” (currently the Australian population as at 30 June 2001 is used).
The primary aim of the projection modelling, however, is to determine the number of cases that we are likely to be observing in future rather than from a hypothetical standard population. Calculating actual numbers and crude rates will better enable us to prepare for actual future population ageing and the impacts across the health and aged care sectors.
Denominators
The denominator used for historical hospitalisations data comes from latest ERP for the relevant year as provided by Statistical Services Branch (SSB), Queensland Health. Population projections used for anticipated denominators in the future comes from QGSO. An important consideration on the choice of population is the Australian Statistical Geography Standard (ASGS) version. Because the QGSO populations projections are based on ASGS2021 historical ERPs, analysis was limited to this population version. To align with the ACE methodology, trend analysis on historical hospitalisation data is limited to seven years from 2016–17 through to 2022–23.
Historical denominators used for survey estimates from the QPHS are derived from the population weighted survey estimate and its standard error. This will provide the appropriate level of historical precision of the estimate, which needs to be considered when projecting into the future. Population projections from QGSO are used as an anticipated future denominator in the same way as hospitalisations.
Validation of historical age group trends
Trends for each indicator by age group are fitted to see if counts are of a reasonable size (at least 10 per year) and to see if there is a consistent trend over the historical period. When counts are low, that age group is removed (as in dementia for the under 45-year-olds and waiting for admission to aged care for the under 15-year-olds), this will have a minimal impact on the overall projection. Inconsistent trend is assessed using a quadratic term. When it is inconsistent, a three-year weighted average of the age-specific rate in the most recent years is used to inform the projection.
Validation of regression methods
For hospitalisations, linear and Poisson regression is used to analyse the age-specific rates. Rates have the characteristic of being constrained to zero (meaning that a negative rate is not possible), Poisson regression is ideal in this situation as it will not allow a rate prediction to go below zero. Linear regression can be applied when hospitalisation rates are increasing as it is unbounded because an individual can be hospitalised multiple times.
Observed and expected values from the regression models are graphed and visually checked to ascertain the goodness of fit of the models. A common rule of thumb is to use equal-length time periods for both the historical trend and the projection. This modelling technique used in this feature article broadly follows the ACE methodology and closely aligns with results for all cause hospitalisations.
Methods for analysing trends for risk factors from the QPHS can be found in the Trends in preventive health risk factors Queensland 2002 to 2013 report.
Definition of hospitalisations
Hospitalisations from public psychiatric hospitals and those flagged as unqualified newborns, organ donors or boarders are excluded and aligns with reporting by Queensland Health and the Australian Institute of Health and Welfare. Hospitalisations for interstate and overseas residents are also excluded as the scope of all reporting throughout the Chief Health Officer report is for the health of Queenslanders.
A hospitalisation is defined as when someone is separated (discharged) from their admission to a hospital. A person can be separated multiple times for their treatment in hospital for example when treatment of their acute stage of their hospital stay ceases and transitions to rehabilitation the patient will be separated and therefore count as multiple hospitalisations even though the patient may not have left the facility. Also to note is that hospitalisations are not a count of individual people as a person can be admitted to hospital on more than one occasion throughout the year. More information regarding hospitalisation definitions can be found at Queensland Hospital Admitted Patient Data Collection (QHAPDC).
Definitions of risk factors
Metadata for risk factors used in these analyses is available from supporting documentation included with the Queensland survey analytic system which is the dissemination arm for the QPHS. QPHS results were used to model overweight and obesity, because the self-report data are more granular and more suited to projection modelling even though it is likely an underestimate.
Figures on this page are interactive
To learn more about how to navigate interactive figures, dashboards, and visualisations, see About this Report.
References
- Australian Bureau of Statistics. 2022. 2021 Census shows Millennials overtaking Boomers, https://www.abs.gov.au/media-centre/media-releases/2021-census-shows-millennials-overtaking-boomers.
- Australian Bureau of Statistics. 2022. Snapshot of Australia, A picture of the economic, social and cultural make-up of Australia on Census night, 10 August 2021, https://www.abs.gov.au/statistics/people/people-and-communities/snapshot-australia/latest-release#health-of-the-population, accessed 23 February 2025.
- Australian Bureau of Statistics. 2024. Historical population, Demographic data going back as far as data is available, https://www.abs.gov.au/statistics/people/population/historical-population/latest-release#data-downloads, accessed 23 February 2025.
- Australian Bureau of Statistics. 2024. Regional population by age and sex, Statistics about the population by age and sex for Australia’s capital cities and regions, https://www.abs.gov.au/statistics/people/population/regional-population-age-and-sex/latest-release#queensland, accessed 23 February 2025.
- Australian Government. 2023. Intergenerational report 2023: Australia’s future to 2063, The Treasury, Parkes, ACT.
- Reid N, Gamage T, Duckett SJ, et al. 2023. Hospital utilisation in Australia, 1993–2020, with a focus on use by people over 75 years of age: a review of AIHW data, Medical Journal of Australia, 219(3):113–119, doi:10.5694/mja2.52026.
- Queensland Health Director-General on improving flow in hospitals. 2025. ABC news, https://www.abc.net.au/news/2025-01-03/queensland-health-director-general-on-improving/104774284, accessed 25 February 2025.
- System Planning Branch. 2024. Acute Care Estimates Methodology (Queensland Health internal publication), Queensland Health, Brisbane, Queensland.
- Australian Institute of Health and Welfare. 2021. Australian Burden of Disease Study: impact and causes of illness and death in Australia 2018. Australian Burden of Disease Study series no. 23. cat. no. BOD 29. Canberra: AIHW., doi:10.25816/5PS1-J259.
- Harris A and Sharma A. 2018. Estimating the future health and aged care expenditure in Australia with changes in morbidity, PloS One, 13(8):e0201697, doi:10.1371/journal.pone.0201697.
- Australian Institute of Health and Welfare. 2014. Australia’s Health 2014, Canberra, ACT, https://www.aihw.gov.au/reports/australias-health/australias-health-2014/overview.
- Australian Institute of Health and Welfare. 2024. Australian Burden of Disease Study 2024, https://www.aihw.gov.au/reports/burden-of-disease/australian-burden-of-disease-study-2024/contents/about, accessed 12 December 2024.