Introduction
Regional health profiles are impacted by the sociodemographic characteristics of the area. Age distributions, in particular influence the types and levels of health conditions that are more common.
Adjusting for age effects
The effects of age can be removed using a statistical technique called age-standardisation. When the effects of age are controlled, other factors that may be impacting health become more apparent. Age-standardisation is commonly used in situations where differences in age structures are likely to occur, such as over time or between regions. Age-standardised rates (ASR or standardised rates) are used throughout this report to highlight changes in health status that are for reasons other than age.
Age distributions are considered when making service deliver decisions, however, to better represent current and anticipated service delivery needs. Crude rates, that have not been adjusted by age, may be more useful for that purpose. In this section, both types of rates are frequently provided. Conditions that are more influenced by age are highlighted in text.
Understanding Queensland results in this section
For health indicators that are less common, smaller populations in regional areas means that multiple years may be combined to produce reliable results. For comparison, Queensland results have also been provided for this same time period. Queensland results provided for comparative purposes may therefore differ from Queensland results in the main sections of this report, which focuses primarily on annual results.
Another difference with Queensland results in this section is that they may be derived from a different data source than in the main sections of this report. This is because regional information was not available from the same source.
Regional rates based on small counts (less than 25 deaths, hospitalisations or cases) are less reliable and are provided but typically not discussed in text.
Mortality
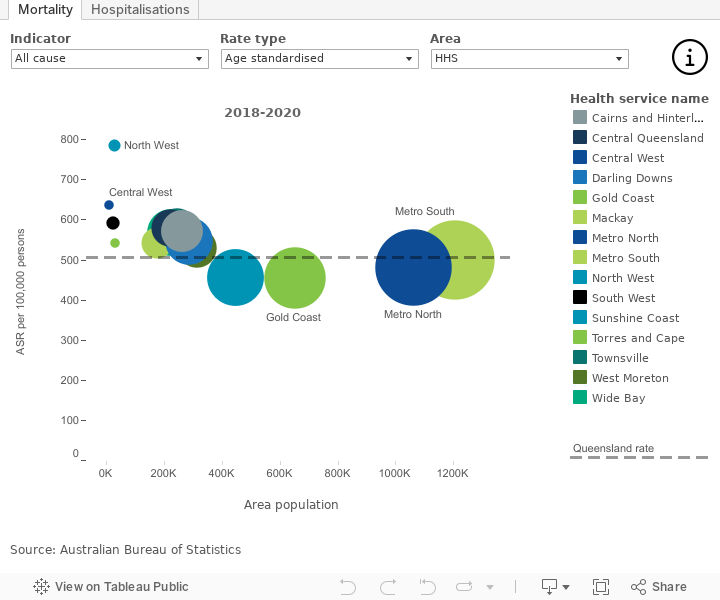
A selection of mortality rates are described below. Additional mortality rates are available in the Figure 1 data dashboard.
All cause mortality:
- Crude all cause mortality rates were highest in Wide Bay HHS, Central West HHS and Darling Downs HHS (977.5, 887.2, and 784.9 per 100,000 persons, respectively)
- Standardised all cause mortality rates were highest in North West HHS, Central West HHS and South West HHS regions (783.9, 635.3, 590.7 per 100,000 persons, respectively).
Mortality due to 7 lifestyle-related chronic conditions:
- The regions with the highest crude mortality rates for 7 lifestyle-related chronic conditions were Wide Bay HHS, Central West HHS and South West HHS regions (440.5, 427.6 and 384.5 per 100,000 persons 15 years and older)
- The regions with the highest age-standardised mortality rates for 7 lifestyle-related chronic conditions were North West HHS, South West HHS and Central West HHS regions (357.5, 301.5 and 301.5 per 100,000 persons age 15 years and older).
Coronary heart disease:
- The regions with the highest crude mortality rates were Central West HHS, Wide Bay HHS and Darling Downs HHS regions (119.8, 107.5 and 97.2 per 100,000 persons, respectively).
Hospitalisations
A selection of hospitalisation rates are described below. Additional hospitalisation rates are available in the Figure 1 data dashboard.
For all-cause hospitalisation:
- Crude rates were highest in North West HHS, Wide Bay HHS and Sunshine Coast HHS regions (76,999, 64,132 and 59,239 per 100,000 persons, respectively).
- The regions with the highest age-standardised rates were North West HHS, Torres and Cape HHS and Townsville HHS regions (82,977, 63,877 and 56,040 per 100,000 persons).
Total potentially preventable hospitalisations:
- Crude rates were highest in North West HHS, Torres and Cape HHS and Central West HHS regions (6,594, and 5,792 and 5,084 per 100,000 persons, respectively).
Falls in persons 65 years or more:
- The regions with the highest crude hospitalisation rates were Gold Coast HHS, Sunshine Coast HHS and Townsville HHS (5,420, 5,070 and 5,006 per 100,000 persons 65 years or more, respectively).
Figure 1: Mortality and hospitalisations by region, Queensland
Cancer
Cancer and other neoplasms is the group of conditions with the highest disease burden, cause the most deaths, and is ranked third among Australian jurisdictions in health system expenditure.
A selection of cancer indicators are described below. Additional cancer indicators are available in the Figure 2 data dashboard.
Screening
From 2019 to 2020:
- Breast cancer participation rates were highest in Townsville HHS (63.6%), Mackay HHS (60.6%) and Central West HHS (57.9%).
From 2020 to 2021:
- Bowel cancer screening participation rates were highest in Sunshine Coast HHS (42.2%), Wide Bay HHS (42.1%) and Metro North HHS (39.0%).
Incidence
In 2020:
- The regions with the highest crude all cancer incidence were Wide bay HHS, Sunshine Coast HHS and Central West HHS (958.1, 779.3 and 727.6 per 100,000 persons, respectively).
- The regions with the highest crude incidence of melanoma were Wide Bay HHS, Darling Downs HHS and Sunshine Coast HHS (134.0, 97.1 and 96.9 per 100,000 persons, respectively).
- The regions with the highest crude incidence of breast cancer among females were Wide Bay HHS, Sunshine Coast HHS and Gold Coast HHS (172.4, 165.5 and 149.2 per 100,000 females, respectively).
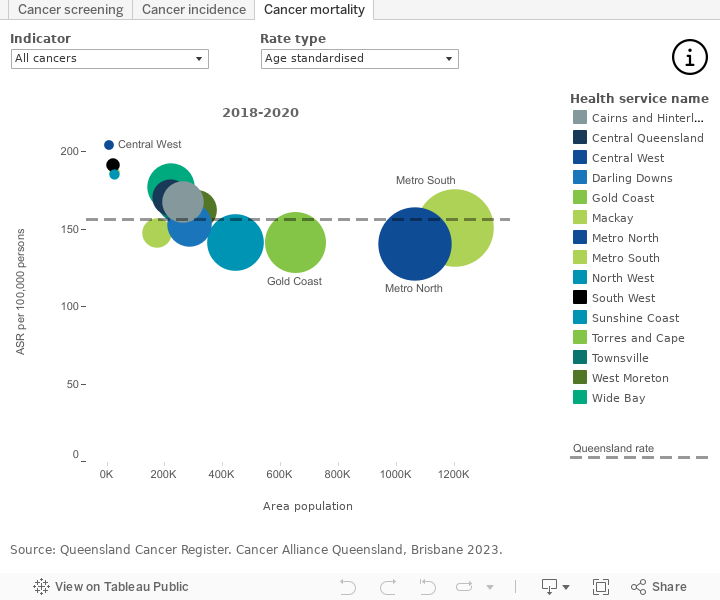
Mortality
In 2020:
- Crude cancer mortality rates were highest in Wide Bay HHS, Central West HHS and South West HHS regions (322.1, 304.8 and 242.6 per 100,000 persons, respectively).
- The regions with the highest crude mortality rates for lung cancer were Wide Bay HHS, Cairns and Hinterland HHS and Central Queensland HHS (74.4, 46.3 and 45.5 per 100,000 persons, respectively).
- The regions with the highest crude mortality rates for prostate cancer were Wide Bay HHS, Cairns and Hinterland HHS and Sunshine Coast HHS (50.1, 42.6 and 37.9 per 100,000 males).
Figure 2: Cancer screening, incidence and mortality by region, Queensland
Additional information
Data and statistics
Data in this section were sourced from:
- Queensland Cancer Control Analysis Team (See Cancer Alliance Queensland for further information)
- BreastScreen Queensland (See Cancer screening for further information)
- National Bowel Cancer Screening Program (See Cancer screening for further information).
Section technical notes
The 7 lifestyle-related chronic conditions (with ICD-10-AM codes) include: breast cancer (C50), lung cancer (C33-C34), colorectal cancer (C18-C20), COPD (J41-J44), coronary heart disease (I20-I25), cerebrovascular disease and related syndromes (I60-I69 & G45-G46), and diabetes (E10-E14).