At a glance
- Nationally, factors other than demographic characteristics are expected to account for 58% of the increase in real spending per person from 2019–20 to 2060–61
- Based on EQ-5D-5L measure, 52.1% Queensland adults reported living with no pain or discomfort
- There were disparities in the mean EQ-5D utility scores by sociodemographic groups
Introduction
COVID-19 caused healthcare systems across the world to find new ways of working, create new partnerships and develop new systems and technologies. These are being leveraged as Queensland Health reforms the health system to focus on outcomes while improving access, equity and quality.
Factors such as population growth and aging, changes in the types and levels of health conditions and risk factor, variation in the price of health goods and services, and the amount and type of services needed to treat patients all contribute to increasing healthcare costs. Nationally, factors other than demographic characteristics are expected to account for 58% of the increase in real spending per person from 2019–20 to 2060–61.1
A focus on outcomes, sustainability, and co-design will require clear measures for decision-making. Maximising wellbeing places additional importance on measures of health-related quality of life (HRQoL) both in healthcare settings and for society more broadly. Because healthcare resources are not unlimited, objective measures of quality and cost will also become more important.
This section will present selected approaches to determine value for money in healthcare. It focuses on quantitative measures and provides population-level results for one measure, the EQ-5D-5L. Quantitative measures are only one aspect used to determine value. Overarching principles such as equity, satisfactions, accountability and transparency are also important considerations.
Measuring value
Delivering value for money in healthcare means achieving the highest level of health relative to expenditure. To distribute resources effectively and efficiently, decisions must be evidence informed. The rapid pace of development in new health technologies means these decisions should be part of continuous quality improvement activities. While a comprehensive list of approaches to determine the value of services relative to individual and population-level health outcomes is beyond the scope of this report, some common approaches include:
- cost-effectiveness analysis (CEA) and cost-utility analysis (CUA) that were developed in the 1970s to determine the cost benefit of treatment options.
- disability adjusted life years (DALYs) were developed in the 1990s to support burden of disease analysis and are currently being extended for analysis of health condition costs.
- More recently co-designed services and value-based healthcare (VBHC) seeks to incentivise high value care and maximise patient value by focusing on health outcomes that matter to consumers.2,3
EQ-5D
The EQ-5D is a commonly used instrument to quantify health-related quality of life (HRQoL) for economic evaluations in health. It consists of questions asking people to rank their current mobility, ability to look after themselves and to do usual activities, physical pain and discomfort, and mental health.
In 2022, the prevalence of reporting no current problems for Queensland adults was:
- 78.2% for their mobility
- 93.5% with their personal care
- 83.2% with their usual activities
- 52.1% had no pain or discomfort
- 67.9% for anxiety or depression.
Responses to EQ-5D questions varied by age. As age increased, higher percentages reported problems with mobility, self-care, and usual activities. Adults were also more likely to experience pain and discomfort as they aged. Conversely, the prevalence of feeling anxious or depressed decreased as age increased.
Table 1: Queensland EQ-5D-5L prevalence, Queensland 2022
| Stratification | Category | Prevalence (%) and 95% confidence intervals | ||||
|---|---|---|---|---|---|---|
| Have no problems today | Have slight problems today | Have moderate problems today | Have severe problems today | Are unable to walk about today | ||
| Person | Person | 78.2 (77.3, 79.0) | 12.9 (12.2, 13.6) | 6.3 (5.8, 6.8) | 2.2 (1.9, 2.5) | 0.4 (0.3, 0.6) |
| Sex | Male | 79.1 (77.9, 80.2) | 12.5 (11.6, 13.5) | 5.9 (5.3, 6.6) | 1.9 (1.6, 2.3) | 0.6 (0.4, 0.8) |
| Sex | Female | 77.3 (76.0, 78.5) | 13.2 (12.2, 14.2) | 6.7 (6.0, 7.4) | 2.5 (2.1, 3.0) | 0.3 (0.2, 0.5) |
| Age group | 18-29 years | 89.4 (87.6, 91.0) | 8.1 (6.7, 9.8) | 1.8 (1.2, 2.6) | 0.5 (0.2, 1.2) | 0.2 (0.1, 0.6) |
| Age group | 30-44 years | 86.8 (85.2, 88.2) | 9.6 (8.4, 11.0) | 2.6 (2.0, 3.4) | 0.7 (0.4, 1.2) | 0.3 (0.1, 0.7) |
| Age group | 45-64 years | 74.8 (73.2, 76.3) | 14.4 (13.2, 15.7) | 7.9 (7.0, 8.9) | 2.5 (2.0, 3.1) | 0.5 (0.3, 0.8) |
| Age group | 65+ years | 61.4 (59.5, 63.2) | 19.3 (17.9, 20.9) | 13.0 (11.8, 14.4) | 5.5 (4.7, 6.5) | 0.8 (0.5, 1.2) |
| Remoteness | Major Cities | 80.2 (79.0, 81.3) | 12.0 (11.1, 13.0) | 5.3 (4.7, 6.0) | 2.0 (1.7, 2.5) | 0.4 (0.3, 0.6) |
| Remoteness | Inner Regional | 72.2 (70.4, 74.0) | 15.3 (13.9, 16.8) | 8.7 (7.7, 9.8) | 3.4 (2.7, 4.2) | 0.4 (0.3, 0.7) |
| Remoteness | Outer Regional | 76.6 (74.6, 78.4) | 13.9 (12.4, 15.5) | 7.3 (6.3, 8.5) | 1.6 (1.2, 2.2) | 0.6 (0.3, 1.1) |
| Remoteness | Remote/Very remote | 79.8 (77.4, 81.9) | 11.4 (9.8, 13.1) | 6.9 (5.5, 8.6) | 1.7 (1.2, 2.4) | 0.4 (0.2, 0.8) |
| SEIFA | Most disadvantaged | 72.8 (70.8, 74.7) | 13.8 (12.4, 15.4) | 9.8 (8.6, 11.1) | 3.1 (2.4, 3.8) | 0.5 (0.3, 0.9) |
| SEIFA | Q2 | 73.8 (71.8, 75.7) | 15.1 (13.6, 16.8) | 8.1 (7.0, 9.4) | 2.6 (2.0, 3.4) | 0.4 (0.2, 0.7) |
| SEIFA | Q3 | 77.9 (76.0, 79.8) | 13.5 (12.0, 15.1) | 5.9 (4.9, 7.0) | 2.2 (1.6, 3.1) | 0.5 (0.2, 1.0) |
| SEIFA | Q4 | 80.8 (78.9, 82.6) | 12.1 (10.6, 13.7) | 4.4 (3.6, 5.4) | 2.2 (1.6, 3.1) | 0.5 (0.3, 0.9) |
| SEIFA | Most advantaged | 84.2 (82.3, 86.0) | 10.2 (8.7, 11.8) | 4.1 (3.3, 5.3) | 1.1 (0.7, 1.7) | 0.3 (0.1, 0.8) |
| Stratification | Category | Prevalence (%) and 95% confidence intervals | ||||
|---|---|---|---|---|---|---|
| Have no problems today | Have slight problems today | Have moderate problems today | Have severe problems today | Are unable to wash or dress yourself today | ||
| Person | Person | 93.5 (93.0, 94.0) | 4.2 (3.8, 4.6) | 1.8 (1.5, 2.1) | 0.3 (0.2, 0.5) | 0.2 (0.1, 0.3) |
| Sex | Male | 94.3 (93.6, 94.9) | 3.6 (3.1, 4.2) | 1.5 (1.2, 1.9) | 0.4 (0.3, 0.7) | 0.2 (0.1, 0.4) |
| Sex | Female | 92.7 (91.9, 93.5) | 4.8 (4.2, 5.4) | 2.0 (1.7, 2.5) | 0.3 (0.1, 0.5) | 0.2 (0.1, 0.4) |
| Age group | 18-29 years | 96.8 (95.7, 97.6) | 2.5 (1.8, 3.4) | 0.7 (0.4, 1.4) | 0.0 (0.0, 0.0) | 0.0 (0.0, 0.0) |
| Age group | 30-44 years | 95.7 (94.6, 96.5) | 2.9 (2.2, 3.7) | 1.1 (0.7, 1.6) | 0.3 (0.1, 0.7) | 0.1 (0.0, 0.4) |
| Age group | 45-64 years | 92.1 (91.1, 93.0) | 4.7 (4.0, 5.6) | 2.3 (1.9, 2.9) | 0.5 (0.3, 0.8) | 0.3 (0.2, 0.6) |
| Age group | 65+ years | 89.5 (88.2, 90.6) | 6.7 (5.8, 7.8) | 2.9 (2.3, 3.6) | 0.5 (0.3, 0.8) | 0.4 (0.2, 0.8) |
| Remoteness | Major Cities | 94.1 (93.4, 94.7) | 3.8 (3.3, 4.4) | 1.5 (1.2, 1.9) | 0.4 (0.2, 0.6) | 0.2 (0.1, 0.3) |
| Remoteness | Inner Regional | 91.7 (90.6, 92.8) | 4.9 (4.1, 5.8) | 2.7 (2.1, 3.4) | 0.4 (0.2, 0.6) | 0.3 (0.1, 0.7) |
| Remoteness | Outer Regional | 92.5 (91.2, 93.6) | 5.3 (4.3, 6.4) | 1.8 (1.3, 2.4) | 0.2 (0.1, 0.4) | 0.3 (0.1, 0.7) |
| Remoteness | Remote/Very remote | 95.4 (94.2, 96.3) | 3.0 (2.3, 4.0) | 1.2 (0.8, 1.8) | 0.2 (0.1, 0.5) | 0.2 (0.1, 0.6) |
| SEIFA | Most disadvantaged | 90.7 (89.3, 91.9) | 5.9 (4.9, 7.0) | 2.9 (2.3, 3.7) | 0.3 (0.1, 0.5) | 0.3 (0.1, 0.6) |
| SEIFA | Q2 | 92.0 (90.7, 93.2) | 5.3 (4.3, 6.4) | 2.1 (1.5, 2.8) | 0.6 (0.3, 1.0) | 0.1 (0.0, 0.2) |
| SEIFA | Q3 | 93.7 (92.5, 94.8) | 3.9 (3.1, 4.9) | 1.7 (1.2, 2.5) | 0.4 (0.2, 1.0) | 0.2 (0.1, 0.5) |
| SEIFA | Q4 | 94.0 (92.8, 95.0) | 3.5 (2.7, 4.5) | 1.8 (1.2, 2.5) | 0.3 (0.1, 0.8) | 0.4 (0.2, 0.9) |
| SEIFA | Most advantaged | 96.4 (95.3, 97.2) | 2.8 (2.1, 3.8) | 0.6 (0.3, 1.2) | 0.1 (0.0, 0.4) | 0.1 (0.0, 0.5) |
| Stratification | Category | Prevalence (%) and 95% confidence intervals | ||||
|---|---|---|---|---|---|---|
| Have no problems today | Have slight problems today | Have moderate problems today | Have severe problems today | Are unable to do your usual activities today | ||
| Person | Person | 83.2 (82.4, 84.0) | 9.2 (8.6, 9.8) | 4.6 (4.2, 5.1) | 1.1 (0.9, 1.3) | 2.0 (1.7, 2.3) |
| Sex | Male | 84.4 (83.3, 85.5) | 8.9 (8.1, 9.8) | 4.1 (3.6, 4.7) | 0.9 (0.7, 1.2) | 1.6 (1.3, 2.0) |
| Sex | Female | 82.0 (80.9, 83.2) | 9.4 (8.5, 10.3) | 5.1 (4.5, 5.8) | 1.2 (0.9, 1.6) | 2.3 (1.9, 2.8) |
| Age group | 18-29 years | 87.7 (85.7, 89.4) | 8.2 (6.8, 9.9) | 2.7 (1.9, 3.7) | 0.3 (0.1, 0.8) | 1.1 (0.7, 1.9) |
| Age group | 30-44 years | 86.6 (85.0, 88.1) | 8.7 (7.5, 10.0) | 3.2 (2.5, 4.1) | 0.6 (0.4, 1.1) | 0.9 (0.5, 1.3) |
| Age group | 45-64 years | 81.4 (80.0, 82.7) | 9.1 (8.1, 10.1) | 5.2 (4.5, 6.0) | 1.5 (1.2, 2.1) | 2.8 (2.3, 3.5) |
| Age group | 65+ years | 77.3 (75.7, 78.9) | 10.8 (9.7, 12.0) | 7.4 (6.5, 8.5) | 1.7 (1.2, 2.2) | 2.8 (2.2, 3.5) |
| Remoteness | Major Cities | 85.0 (84.0, 86.1) | 8.2 (7.4, 9.1) | 4.1 (3.6, 4.8) | 0.7 (0.5, 1.0) | 1.8 (1.5, 2.3) |
| Remoteness | Inner Regional | 79.0 (77.3, 80.6) | 10.9 (9.7, 12.2) | 5.7 (4.9, 6.7) | 1.9 (1.4, 2.6) | 2.5 (2.0, 3.2) |
| Remoteness | Outer Regional | 80.0 (78.0, 81.8) | 11.4 (10.0, 13.0) | 5.6 (4.6, 6.8) | 1.4 (0.9, 2.0) | 1.7 (1.2, 2.3) |
| Remoteness | Remote/Very remote | 85.6 (83.5, 87.4) | 8.4 (7.0, 10.0) | 3.0 (2.2, 4.0) | 1.4 (0.9, 2.2) | 1.6 (1.0, 2.6) |
| SEIFA | Most disadvantaged | 77.2 (75.3, 79.0) | 11.1 (9.8, 12.6) | 6.6 (5.5, 7.7) | 2.1 (1.5, 2.8) | 3.0 (2.3, 3.9) |
| SEIFA | Q2 | 81.2 (79.4, 82.8) | 10.4 (9.1, 11.8) | 5.0 (4.1, 6.0) | 1.4 (0.9, 2.1) | 2.0 (1.5, 2.7) |
| SEIFA | Q3 | 83.0 (81.1, 84.7) | 9.5 (8.2, 11.0) | 4.5 (3.6, 5.6) | 1.1 (0.7, 1.7) | 1.9 (1.4, 2.7) |
| SEIFA | Q4 | 85.3 (83.5, 86.9) | 8.3 (7.1, 9.7) | 3.9 (3.1, 4.9) | 0.8 (0.5, 1.3) | 1.7 (1.2, 2.5) |
| SEIFA | Most advantaged | 88.2 (86.4, 89.8) | 6.9 (5.7, 8.3) | 3.4 (2.6, 4.5) | 0.2 (0.1, 0.6) | 1.3 (0.8, 2.0) |
| Stratification | Category | Prevalence (%) and 95% confidence intervals | ||||
|---|---|---|---|---|---|---|
| No pain or discomfort today | Slight pain or discomfort today | Moderate pain or discomfort today | Severe pain or discomfort today | Extreme pain or discomfort today | ||
| Person | Person | 52.1 (51.0, 53.1) | 32.6 (31.6, 33.6) | 12.1 (11.4, 12.8) | 2.6 (2.3, 3.0) | 0.7 (0.5, 0.9) |
| Sex | Male | 54.1 (52.6, 55.6) | 33.0 (31.5, 34.4) | 10.3 (9.5, 11.2) | 2.1 (1.7, 2.5) | 0.5 (0.4, 0.8) |
| Sex | Female | 50.1 (48.6, 51.6) | 32.2 (30.8, 33.6) | 13.8 (12.8, 14.8) | 3.2 (2.7, 3.7) | 0.8 (0.6, 1.1) |
| Age group | 18-29 years | 61.4 (58.6, 64.1) | 30.2 (27.7, 32.9) | 7.0 (5.8, 8.6) | 0.9 (0.5, 1.7) | 0.4 (0.1, 1.0) |
| Age group | 30-44 years | 57.0 (54.8, 59.2) | 31.0 (29.0, 33.1) | 9.7 (8.4, 11.0) | 1.7 (1.2, 2.4) | 0.6 (0.3, 1.1) |
| Age group | 45-64 years | 47.7 (45.9, 49.5) | 34.6 (32.9, 36.4) | 13.4 (12.2, 14.6) | 3.6 (3.0, 4.4) | 0.7 (0.5, 1.0) |
| Age group | 65+ years | 43.3 (41.4, 45.2) | 33.7 (31.9, 35.5) | 18.1 (16.6, 19.6) | 4.0 (3.3, 4.8) | 0.9 (0.6, 1.4) |
| Remoteness | Major Cities | 54.1 (52.7, 55.6) | 32.0 (30.6, 33.4) | 10.9 (10.0, 11.8) | 2.4 (2.0, 2.9) | 0.6 (0.4, 0.8) |
| Remoteness | Inner Regional | 46.0 (43.9, 48.0) | 35.0 (33.0, 36.9) | 14.5 (13.2, 15.9) | 3.5 (2.8, 4.3) | 1.1 (0.7, 1.7) |
| Remoteness | Outer Regional | 49.3 (47.0, 51.7) | 33.2 (31.0, 35.4) | 14.6 (13.1, 16.4) | 2.5 (1.9, 3.3) | 0.3 (0.2, 0.6) |
| Remoteness | Remote/Very remote | 57.5 (54.4, 60.6) | 28.5 (25.6, 31.4) | 10.9 (9.2, 12.8) | 2.2 (1.5, 3.1) | 1.0 (0.6, 1.6) |
| SEIFA | Most disadvantaged | 46.1 (43.8, 48.3) | 32.8 (30.7, 34.9) | 15.5 (14.0, 17.1) | 4.5 (3.6, 5.5) | 1.1 (0.7, 1.7) |
| SEIFA | Q2 | 48.5 (46.3, 50.7) | 33.4 (31.3, 35.5) | 14.3 (12.9, 15.9) | 3.0 (2.3, 3.8) | 0.8 (0.5, 1.3) |
| SEIFA | Q3 | 52.2 (49.8, 54.5) | 33.1 (30.9, 35.3) | 11.3 (10.0, 12.9) | 2.8 (2.1, 3.7) | 0.7 (0.4, 1.2) |
| SEIFA | Q4 | 52.5 (50.1, 55.0) | 33.2 (31.0, 35.6) | 11.3 (9.9, 12.9) | 2.5 (1.8, 3.3) | 0.5 (0.3, 1.0) |
| SEIFA | Most advantaged | 59.9 (57.2, 62.5) | 30.4 (28.0, 33.0) | 8.6 (7.3, 10.2) | 0.8 (0.5, 1.4) | 0.3 (0.1, 0.9) |
| Stratification | Category | Prevalence (%) and 95% confidence intervals | ||||
|---|---|---|---|---|---|---|
| Not anxious or depressed today | Slightly anxious or depressed today | Moderately anxious or depressed today | Severely anxious or depressed today | Extremely anxious or depressed today | ||
| Person | Person | 67.9 (66.9, 69.0) | 20.5 (19.6, 21.4) | 9.2 (8.5, 9.8) | 1.7 (1.4, 2.0) | 0.8 (0.6, 1.0) |
| Sex | Male | 71.8 (70.3, 73.2) | 18.5 (17.3, 19.7) | 8.1 (7.3, 9.0) | 1.2 (0.9, 1.6) | 0.4 (0.3, 0.6) |
| Sex | Female | 64.3 (62.8, 65.7) | 22.4 (21.1, 23.7) | 10.2 (9.2, 11.1) | 2.1 (1.7, 2.6) | 1.1 (0.8, 1.5) |
| Age group | 18-29 years | 60.0 (57.2, 62.8) | 24.6 (22.2, 27.1) | 12.3 (10.6, 14.4) | 2.3 (1.6, 3.4) | 0.7 (0.4, 1.4) |
| Age group | 30-44 years | 64.1 (61.9, 66.2) | 23.9 (22.0, 25.9) | 9.2 (8.0, 10.5) | 1.9 (1.3, 2.6) | 0.9 (0.6, 1.5) |
| Age group | 45-64 years | 70.0 (68.4, 71.7) | 18.9 (17.5, 20.3) | 8.6 (7.7, 9.7) | 1.6 (1.2, 2.2) | 0.8 (0.5, 1.2) |
| Age group | 65+ years | 77.3 (75.6, 78.9) | 14.5 (13.2, 15.9) | 6.9 (5.9, 7.9) | 0.8 (0.5, 1.2) | 0.6 (0.3, 0.9) |
| Remoteness | Major Cities | 67.1 (65.7, 68.5) | 21.2 (20.0, 22.5) | 9.3 (8.5, 10.2) | 1.7 (1.3, 2.1) | 0.7 (0.5, 0.9) |
| Remoteness | Inner Regional | 68.9 (67.0, 70.8) | 19.0 (17.5, 20.7) | 9.3 (8.1, 10.6) | 1.7 (1.2, 2.3) | 1.0 (0.7, 1.6) |
| Remoteness | Outer Regional | 68.4 (66.0, 70.6) | 19.8 (17.9, 21.8) | 9.1 (7.8, 10.6) | 1.8 (1.2, 2.6) | 1.0 (0.6, 1.8) |
| Remoteness | Remote/Very remote | 75.4 (72.5, 78.2) | 17.0 (14.6, 19.7) | 6.1 (4.6, 7.9) | 0.8 (0.4, 1.4) | 0.7 (0.4, 1.4) |
| SEIFA | Most disadvantaged | 66.7 (64.5, 68.9) | 18.0 (16.3, 19.8) | 11.5 (10.1, 13.1) | 2.7 (2.0, 3.7) | 1.1 (0.7, 1.7) |
| SEIFA | Q2 | 69.4 (67.2, 71.5) | 19.1 (17.4, 21.0) | 9.1 (7.8, 10.5) | 1.7 (1.2, 2.4) | 0.8 (0.4, 1.3) |
| SEIFA | Q3 | 67.5 (65.2, 69.7) | 21.2 (19.3, 23.2) | 8.3 (7.1, 9.8) | 2.2 (1.5, 3.0) | 0.8 (0.5, 1.5) |
| SEIFA | Q4 | 67.3 (64.9, 69.6) | 21.1 (19.1, 23.2) | 10.0 (8.5, 11.6) | 1.0 (0.6, 1.7) | 0.6 (0.4, 1.1) |
| SEIFA | Most advantaged | 68.8 (66.2, 71.2) | 22.4 (20.2, 24.8) | 7.3 (6.0, 8.9) | 1.0 (0.5, 1.7) | 0.6 (0.3, 1.2) |
Source: Queensland Government. Queensland survey analytic system (QSAS) https://www.health.qld.gov.au/phsurvey.
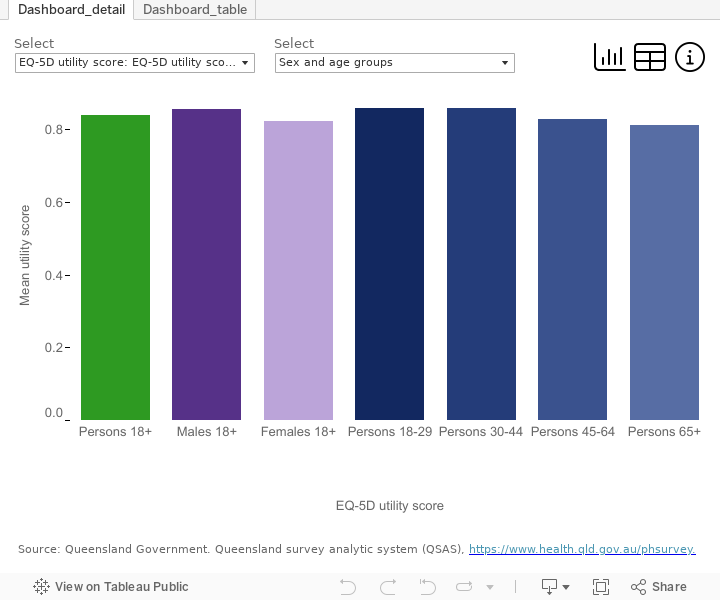
EQ-5D scores can also be expressed as a summary index known as a utility score, which is scaled from 0 (death) to 1 (perfect health).4 Based on the EQ-5D-5L, Queensland adults reported an average utility score of 0.84.
- Males reported slightly higher mean score (0.85) than females (0.82).
- Utility scores decreased as people aged, ranging from 0.86 in 18 to 29 year olds to 0.81 in adults 65 years and older.
- Queenslanders in socioeconomically disadvantaged areas reported lower utility score than those in more advantaged areas, decreasing from an average of 0.87 to 0.80.
- People living in remote or very remote areas reported higher utility scores (0.87) than those living in other parts of Queensland (0.85, 0.82 and 0.83 for those living in major cities, inner regional and outer regional areas, respectively).
- People who smoked daily reported lower utility score (0.76) than those who do not smoke daily (0.85).
- People who abstained from alcohol consumption reported lower mean utility scores than those who consumed alcohol (0.79 and 0.85, respectively)
- On average, obese people reported lower utility scores (0.78) than adults with a healthy body weight (0.87).
Figure 1: Mean EQ-5D utility score for Queensland adults, 2022
It is important to note that the relationship between modifiable risk factors and EQ-5D utility scores are not causal. For example, although people who consumed alcohol had a higher mean utility score than those who abstained from drinking, this cannot be interpreted as a causal relationship between alcohol consumption and utility scores. Similarly, lower utility score among daily smokers may not necessarily be because they smoke cigarettes, but rather, the combination of other lifestyle characteristics in smoking population that may impact their health status.
Additional information
The EQ-5D is a trade mark of the EuroQoL Group and use of the instrument must be registered.
The EQ-5D is a listed generic patient reported outcomes measure by the Australian Commission on Safety and Quality in Health Care.
References
- Australian Treasury. 2021. 2021 Intergenerational Report: Australia over the Next 40 Years. Canberra: The Treasury.
- Walraven J., Jacobs M.S. & Uyl-de Groot C.A. 2021. Leveraging the Similarities Between Cost-Effectiveness Analysis and Value-Based Healthcare. Value in Health. 24(7): 1038–1044. doi: 10.1016/j.jval.2021.01.010.
- Sassi F. 2006. Calculating QALYs, comparing QALY and DALY calculations. Health Policy and Planning. 21(5): 402–408. doi: 10.1093/heapol/czl018.
- Norman R., Cronin P. & Viney R. 2013. A Pilot Discrete Choice Experiment to Explore Preferences for EQ-5D-5L Health States. Applied Health Economics and Health Policy. 11(3): 287–298. doi: 10.1007/s40258-013-0035-z.