At a glance
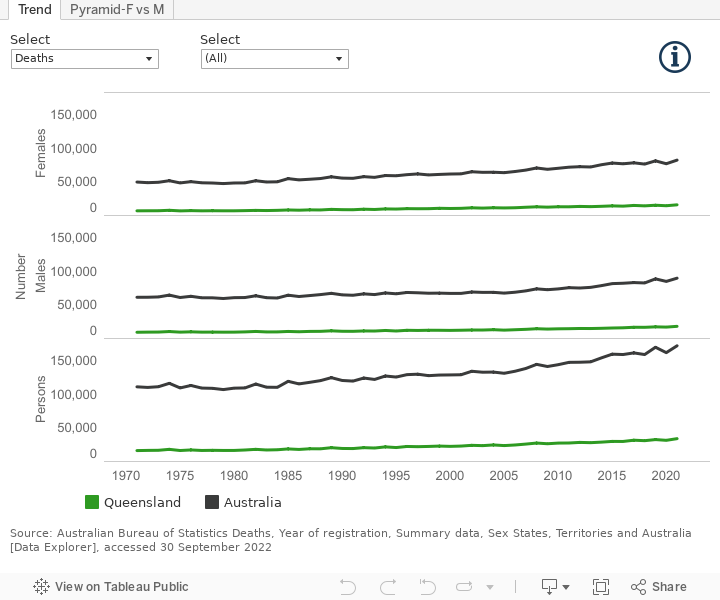
In 2021, there were 33,858 deaths of Queensland residents.
From 1971 to 2021, several mortality measures improved in Queensland:
- age-standardised mortality rates decreased from 12.7 to 5.2 per 1,000 persons
- median age of death increased from 70.4 to 80.7 years
- infant mortality rates decreased from 19.0 to 3.8 per 1,000 live births.
There were disparities in Queensland mortality measures, however:
- Compared to major cities, the age-standardised mortality rate was 24% higher in remote and very remote areas (5.0 and 6.2 per 1,000 persons, respectively) and the median age at death was 7.8 years younger (81.3 and 73.5 years, respectively) in 2021.
- Compared to the most advantaged areas, the age-standardised mortality rate was 43% higher in the most disadvantaged areas (4.0 and 5.7 per 1,000 persons, respectively) and the median age at death was 4.0 years younger (78.0 and 82.0 years, respectively) in 2020.
For the period 2016–2020, the leading cause of death was coronary heart disease in males, and dementia including Alzheimer's disease in females.
There were 1,757 people who died from COVID-19 in Queensland.
Introduction
Mortality is used internationally as an indicator of overall population health and socioeconomic development. Differences in mortality patterns are commonly used in public health to identify new pathogens, exposure to harmful substances or conditions, or underlying inequity that may negatively impact health.
Key statistics
In 2021, 33,858 Queensland residents died for an age-standardised mortality rate (ASR or standardised rate) of 5.2 per 1,000 persons. Females had a lower standardised mortality rate (4.4 per 1,000) than males (6.1 per 1,000).
- The Queensland rate was similar to the Australian rate (5.1 per 1,000 persons) and Queensland had the 4th highest standardised mortality rate among the jurisdictions.1
- Median age at death in Queensland in 2021 was 80.7 years (78.2 for males and 83.7 years for females).1
- More than a third (37.0%) of deaths were of people aged 85 years and older.
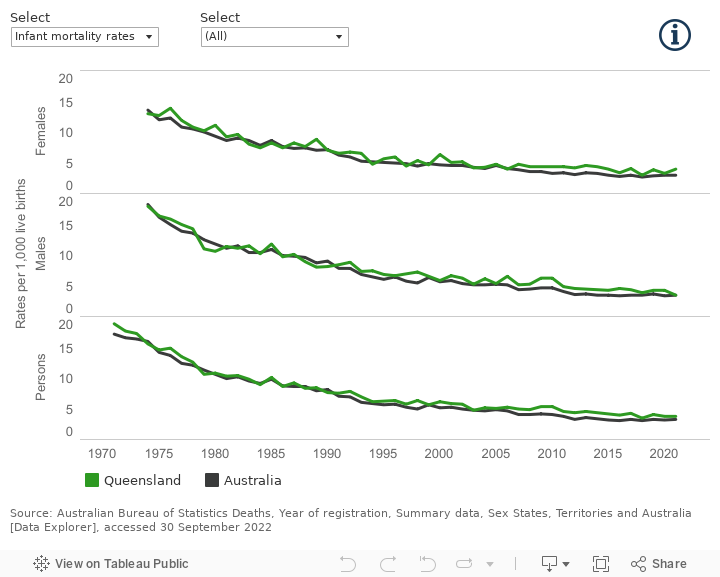
Infant mortality
In 2021, there were 241 infants deaths (defined as a death before 12 months of age), resulting in an infant mortality rate of 3.8 per 1,000 live births.1 The Australian infant mortality rate was 3.3 per 1,000 live births and Queensland ranked 5th among Australian jurisdictions.
Perinatal mortality
In 2020, there were 668 perinatal deaths in Queensland, that is stillborn infants or a death in the first 28 days. Of these, 70.7% were stillbirths. The perinatal death rate was 11.2 per 1,000 births.2
Queensland ranked 6th in 2020 among the jurisdictions based on the national definition of perinatal deaths.3
Mortality trends
Queensland mortality rates steadily declined over the last several decades, a trend similarly seen for Australia overall (Figure 1).
- In 1971, the standardised mortality rate for Queensland was 12.7 per 1,000 persons reducing to 5.2 per 1,000 persons in 20211
- Median age of death increased from 70.4 years in 1971 to 80.7 years in 2021.1
- Infant mortality rate decreased from 19.0 per 1,000 live births in 1971 to 3.8 per 1,000 live births in 20211
Figure 1: Queensland trends in selected mortality measures
Age at death
Older people have a higher risk of death than younger age groups. Age distributions are changing in most developed countries with older age groups making up a larger proportion of the total population. This, and increasing population size, means that the number of deaths will continue to increase. Age-specific rates and standardised rates, which adjust for changing age distributions, better monitor changes over time.
In 2021, 37.0% of Queensland deaths were among adults 85 years and older (Figure 2), while this age group makes up only 1.8% of the population.4
Figure 2: Age distribution of death by sex, 2021


| State | Sex | Age group | Number of deaths | Proportion |
|---|---|---|---|---|
| Queensland | Males | 0-4 | 136 | 0.8 |
| Queensland | Males | 5-9 | 13 | 0.1 |
| Queensland | Males | 10-14 | 21 | 0.1 |
| Queensland | Males | 15-19 | 89 | 0.5 |
| Queensland | Males | 20-24 | 128 | 0.7 |
| Queensland | Males | 25-29 | 146 | 0.8 |
| Queensland | Males | 30-34 | 171 | 0.9 |
| Queensland | Males | 35-39 | 204 | 1.1 |
| Queensland | Males | 40-44 | 273 | 1.5 |
| Queensland | Males | 45-49 | 379 | 2.1 |
| Queensland | Males | 50-54 | 530 | 2.9 |
| Queensland | Males | 55-59 | 799 | 4.4 |
| Queensland | Males | 60-64 | 1,064 | 5.9 |
| Queensland | Males | 65-69 | 1,388 | 7.7 |
| Queensland | Males | 70-74 | 2,147 | 11.9 |
| Queensland | Males | 75-79 | 2,459 | 13.6 |
| Queensland | Males | 80-84 | 2,802 | 15.5 |
| Queensland | Males | 85-89 | 2,625 | 14.6 |
| Queensland | Males | 90-94 | 1,883 | 10.4 |
| Queensland | Males | 95-99 | 673 | 3.7 |
| Queensland | Males | 100+ years | 96 | 0.5 |
| Queensland | Females | 0-4 | 146 | 0.9 |
| Queensland | Females | 5-9 | 9 | 0.1 |
| Queensland | Females | 10-14 | 17 | 0.1 |
| Queensland | Females | 15-19 | 31 | 0.2 |
| Queensland | Females | 20-24 | 41 | 0.3 |
| Queensland | Females | 25-29 | 49 | 0.3 |
| Queensland | Females | 30-34 | 71 | 0.4 |
| Queensland | Females | 35-39 | 116 | 0.7 |
| Queensland | Females | 40-44 | 163 | 1.0 |
| Queensland | Females | 45-49 | 227 | 1.4 |
| Queensland | Females | 50-54 | 334 | 2.1 |
| Queensland | Females | 55-59 | 490 | 3.1 |
| Queensland | Females | 60-64 | 701 | 4.4 |
| Queensland | Females | 65-69 | 913 | 5.8 |
| Queensland | Females | 70-74 | 1,343 | 8.5 |
| Queensland | Females | 75-79 | 1,651 | 10.4 |
| Queensland | Females | 80-84 | 2,267 | 14.3 |
| Queensland | Females | 85-89 | 2,659 | 16.8 |
| Queensland | Females | 90-94 | 2,821 | 17.8 |
| Queensland | Females | 95-99 | 1,468 | 9.3 |
| Queensland | Females | 100+ years | 315 | 2.0 |
| Queensland | Persons | 0-4 | 282 | 0.8 |
| Queensland | Persons | 5-9 | 22 | 0.1 |
| Queensland | Persons | 10-14 | 38 | 0.1 |
| Queensland | Persons | 15-19 | 120 | 0.4 |
| Queensland | Persons | 20-24 | 169 | 0.5 |
| Queensland | Persons | 25-29 | 195 | 0.6 |
| Queensland | Persons | 30-34 | 242 | 0.7 |
| Queensland | Persons | 35-39 | 320 | 0.9 |
| Queensland | Persons | 40-44 | 436 | 1.3 |
| Queensland | Persons | 45-49 | 606 | 1.8 |
| Queensland | Persons | 50-54 | 864 | 2.6 |
| Queensland | Persons | 55-59 | 1,289 | 3.8 |
| Queensland | Persons | 60-64 | 1,765 | 5.2 |
| Queensland | Persons | 65-69 | 2,301 | 6.8 |
| Queensland | Persons | 70-74 | 3,490 | 10.3 |
| Queensland | Persons | 75-79 | 4,110 | 12.1 |
| Queensland | Persons | 80-84 | 5,069 | 15.0 |
| Queensland | Persons | 85-89 | 5,284 | 15.6 |
| Queensland | Persons | 90-94 | 4,704 | 13.9 |
| Queensland | Persons | 95-99 | 2,141 | 6.3 |
| Queensland | Persons | 100+ years | 411 | 1.2 |
| Australia | Males | 0-4 | 651 | 0.7 |
| Australia | Males | 5-9 | 66 | 0.1 |
| Australia | Males | 10-14 | 92 | 0.1 |
| Australia | Males | 15-19 | 326 | 0.4 |
| Australia | Males | 20-24 | 498 | 0.6 |
| Australia | Males | 25-29 | 623 | 0.7 |
| Australia | Males | 30-34 | 766 | 0.9 |
| Australia | Males | 35-39 | 894 | 1.0 |
| Australia | Males | 40-44 | 1,125 | 1.3 |
| Australia | Males | 45-49 | 1,725 | 1.9 |
| Australia | Males | 50-54 | 2,595 | 2.9 |
| Australia | Males | 55-59 | 3,749 | 4.2 |
| Australia | Males | 60-64 | 5,084 | 5.7 |
| Australia | Males | 65-69 | 6,811 | 7.6 |
| Australia | Males | 70-74 | 9,737 | 10.9 |
| Australia | Males | 75-79 | 11,518 | 12.9 |
| Australia | Males | 80-84 | 13,797 | 15.4 |
| Australia | Males | 85-89 | 13,925 | 15.6 |
| Australia | Males | 90-94 | 11,016 | 12.3 |
| Australia | Males | 95-99 | 3,885 | 4.3 |
| Australia | Males | 100+ years | 514 | 0.6 |
| Australia | Females | 0-4 | 510 | 0.6 |
| Australia | Females | 5-9 | 53 | 0.1 |
| Australia | Females | 10-14 | 62 | 0.1 |
| Australia | Females | 15-19 | 140 | 0.2 |
| Australia | Females | 20-24 | 203 | 0.2 |
| Australia | Females | 25-29 | 231 | 0.3 |
| Australia | Females | 30-34 | 326 | 0.4 |
| Australia | Females | 35-39 | 517 | 0.6 |
| Australia | Females | 40-44 | 711 | 0.9 |
| Australia | Females | 45-49 | 1,099 | 1.3 |
| Australia | Females | 50-54 | 1,556 | 1.9 |
| Australia | Females | 55-59 | 2,329 | 2.8 |
| Australia | Females | 60-64 | 3,212 | 3.9 |
| Australia | Females | 65-69 | 4,424 | 5.4 |
| Australia | Females | 70-74 | 6,550 | 8.0 |
| Australia | Females | 75-79 | 8,225 | 10.0 |
| Australia | Females | 80-84 | 11,491 | 14.0 |
| Australia | Females | 85-89 | 14,485 | 17.7 |
| Australia | Females | 90-94 | 15,552 | 19.0 |
| Australia | Females | 95-99 | 8,530 | 10.4 |
| Australia | Females | 100+ years | 1,859 | 2.3 |
| Australia | Persons | 0-4 | 1,161 | 0.7 |
| Australia | Persons | 5-9 | 119 | 0.1 |
| Australia | Persons | 10-14 | 154 | 0.1 |
| Australia | Persons | 15-19 | 466 | 0.3 |
| Australia | Persons | 20-24 | 701 | 0.4 |
| Australia | Persons | 25-29 | 854 | 0.5 |
| Australia | Persons | 30-34 | 1,092 | 0.6 |
| Australia | Persons | 35-39 | 1,411 | 0.8 |
| Australia | Persons | 40-44 | 1,836 | 1.1 |
| Australia | Persons | 45-49 | 2,824 | 1.6 |
| Australia | Persons | 50-54 | 4,151 | 2.4 |
| Australia | Persons | 55-59 | 6,078 | 3.5 |
| Australia | Persons | 60-64 | 8,296 | 4.8 |
| Australia | Persons | 65-69 | 11,235 | 6.6 |
| Australia | Persons | 70-74 | 16,287 | 9.5 |
| Australia | Persons | 75-79 | 19,743 | 11.5 |
| Australia | Persons | 80-84 | 25,288 | 14.7 |
| Australia | Persons | 85-89 | 28,410 | 16.6 |
| Australia | Persons | 90-94 | 26,568 | 15.5 |
| Australia | Persons | 95-99 | 12,415 | 7.2 |
| Australia | Persons | 100+ years | 2,373 | 1.4 |
Remoteness and socioeconomic differences
Queensland is a diverse state with areas classified from major cities to remote or very remote based on travel distances to the nearest service centre.5 Socioeconomic differences are assessed using the area-based index of socioeconomic advantage and disadvantage.6
In 2021 (Figure 3):
- Standardised death rates were 5.0 per 1,000 persons for major cities and 6.2 per 1,000 persons remote and very remote areas.7
- The median age at death for people living in major cities was 81.3 years, while it was 73.5 years for those living in remote or very remote areas.
- While infant mortality rates were 37.8% in outer regional areas compared to major cities, all remoteness categories were higher than the national rate.
In 2020 (Figure 3):
- The standardised death rate in the most socioeconomically disadvantaged areas was 43.4% higher than that of the most advantaged areas (5.7 per 1,000 persons compared with 4.0 per 1,000 persons).6
Figure 3: Queensland selected mortality measures by remoteness and socioeconomic status


| Year | Area classification | Area category | Measure | Result |
|---|---|---|---|---|
| 2021 | Remoteness | Major cities | Infant mortality rates | 3.7 |
| 2021 | Remoteness | Inner regional | Infant mortality rates | 3.9 |
| 2021 | Remoteness | Outer regional | Infant mortality rates | 5.1 |
| 2021 | Remoteness | Remote and very remote | Infant mortality rates | 4.1 |
| 2021 | Remoteness | Major cities | Median age at death | 81.3 |
| 2021 | Remoteness | Inner regional | Median age at death | 80.1 |
| 2021 | Remoteness | Outer regional | Median age at death | 78.1 |
| 2021 | Remoteness | Remote and very remote | Median age at death | 73.5 |
| 2020 | SEIFA | Most disadvantaged | Median age at death | 78.0 |
| 2020 | SEIFA | Q2 | Median age at death | 80.0 |
| 2020 | SEIFA | Q3 | Median age at death | 80.0 |
| 2020 | SEIFA | Q4 | Median age at death | 81.0 |
| 2020 | SEIFA | Most advantaged | Median age at death | 82.0 |
| 2021 | Remoteness | Major cities | Standardised death rate | 5.0 |
| 2021 | Remoteness | Inner regional | Standardised death rate | 5.4 |
| 2021 | Remoteness | Outer regional | Standardised death rate | 5.9 |
| 2021 | Remoteness | Remote and very remote | Standardised death rate | 6.2 |
| 2020 | SEIFA | Most disadvantaged | Standardised death rate | 5.7 |
| 2020 | SEIFA | Q2 | Standardised death rate | 5.2 |
| 2020 | SEIFA | Q3 | Standardised death rate | 4.7 |
| 2020 | SEIFA | Q4 | Standardised death rate | 4.0 |
| 2020 | SEIFA | Most advantaged | Standardised death rate | 4.0 |
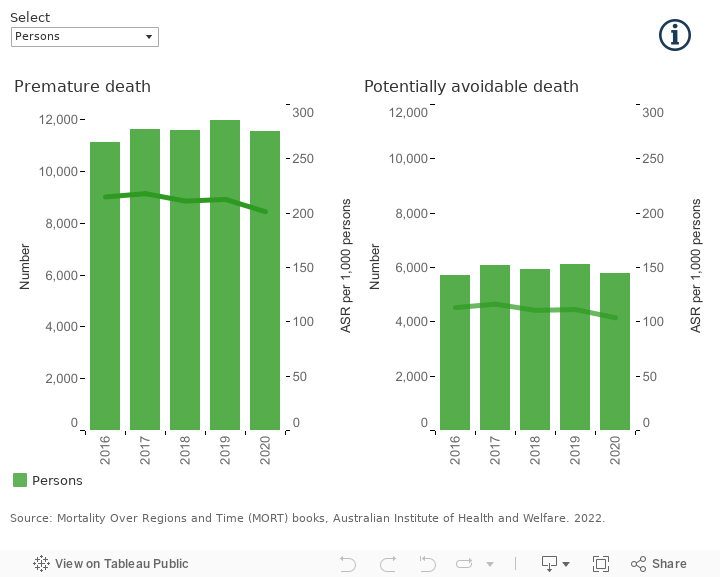
Premature and potentially avoidable deaths
Measures of avoidable mortality, such as premature and potentially avoidable deaths, provide a broad indication of the effectiveness of health care systems and public health strategies.
Premature deaths are defined as death before 75 years of age. In 2020 (Figure 4):
- 36.8% of deaths in Queensland were premature deaths.
- Males had a higher standardised premature death rate (2.6 per 1,000) than females (1.5 per 1,000).
- The standardised premature death rate in Queensland was similar to the national rate (2.0 per 1,000 compared to 1.9 per 1,000, respectively) and Queensland ranked 5th among the Australian states and territories.8
A subset of premature deaths from certain conditions are considered potentially avoidable meaning that they could have been prevented with individualised care or through existing health care services. Potentially avoidable deaths (PADs) are classified using the National Healthcare Agreement definition in this report,9 and in Queensland in 2020, 50.1% of premature deaths were classified as potentially avoidable.8
Figure 4: Queensland premature and potentially avoidable deaths
Leading causes of death
For the period 2016–2020, the leading cause of death for Queensland residents was coronary heart disease (Table 1). There were sex differences, however, with dementia including Alzheimer’s disease the leading cause for females and coronary heart disease for males.8
The top five leading causes of death in this 5-year period in Queensland were:
- Coronary heart disease: 11.9% of all deaths (12.9% for males and 10.8% for females)
- Dementia including Alzheimer’s disease: 8.3% of all deaths (5.8% for males and 11.2% for females)
- Cerebrovascular disease: 6.3% of all deaths (5.0% for males and 7.8% for females)
- Lung cancer: 5.8% of all deaths (6.5% for males and 5.1% for females)
- Chronic obstructive pulmonary disease: 4.6% of all deaths (4.9% for males and 4.4% for females)
- The 6th leading cause for males was prostate (4.5%) and and females was breast (4.0%) cancer.
| Ranking | Males | Females | Persons |
|---|---|---|---|
| 1 | Coronary heart disease (I20–I25) | Dementia including Alzheimer’s disease (F01, F03, G30) | Coronary heart disease (I20–I25) |
| 2 | Lung cancer (C33, C34) | Coronary heart disease (I20–I25) | Dementia including Alzheimer’s disease (F01, F03, G30) |
| 3 | Dementia including Alzheimer’s disease (F01, F03, G30) | Cerebrovascular disease (I60–I69) | Cerebrovascular disease (I60–I69) |
| 4 | Cerebrovascular disease (I60–I69) | Lung cancer (C33, C34) | Lung cancer (C33, C34) |
| 5 | Chronic obstructive pulmonary disease (COPD) (J40–J44) | Chronic obstructive pulmonary disease (COPD) (J40–J44) | Chronic obstructive pulmonary disease (COPD) (J40–J44) |
| 6 | Prostate cancer (C61) | Breast cancer (C50) | Colorectal cancer (C18–C20, C26.0) |
| 7 | Colorectal cancer (C18–C20, C26.0) | Colorectal cancer (C18–C20, C26.0) | Diabetes (E10–E14) |
| 8 | Suicide (X60–X84, Y87.0) | Diabetes (E10–E14) | Suicide (X60–X84, Y87.0) |
| 9 | Diabetes (E10–E14) | Influenza and pneumonia (J09–J18) | Prostate cancer (C61) |
| 10 | Cancer of unknown or ill-defined primary site (C26, C39, C76–C80 excl. C26.0) | Pancreatic cancer (C25) | Cancer of unknown or ill-defined primary site (C26, C39, C76–C80 excl. C26.0) |
| 11 | Pancreatic cancer (C25) | Cancer of unknown or ill-defined primary site (C26, C39, C76–C80 excl. C26.0) | Breast cancer (C50) |
| 12 | Liver cancer (C22) | Cardiac arrhythmias (I47–I49) | Pancreatic cancer (C25) |
| 13 | Liver disease (K70–K76) | Hypertensive disease (I10–I15) | Influenza and pneumonia (J09–J18) |
| 14 | Influenza and pneumonia (J09–J18) | Heart failure and complications and ill-defined heart disease (I50–I51) | Heart failure and complications and ill-defined heart disease (I50–I51) |
| 15 | Leukaemia (C91–C95) | Accidental falls (W00–W19) | Cardiac arrhythmias (I47–I49) |
| 16 | Parkinson disease (G20) | Non-rheumatic valve disorders (I34–I38) | Accidental falls (W00–W19) |
| 17 | Melanoma of the skin (C43) | Ovarian cancer (C56) | Liver disease (K70–K76) |
| 18 | Land transport accidents (V01–V89) | Suicide (X60–X84, Y87.0) | Liver cancer (C22) |
| 19 | Accidental falls (W00–W19) | Kidney failure (N17–N19) | Leukaemia (C91–C95) |
| 20 | Oesophageal cancer (C15) | Diseases of the musculoskeletal system and connective tissue (M00–M99) | Parkinson disease (G20) |
COVID-19
During the early phase of COVID-19 pandemic, Australia’s strict border control and public health measures minimised the number of deaths due to the disease. From 2020 to 2021, a total of 10 Queenslanders died from COVID-19.10 After adjusting for population size, this was still far fewer than in other countries. In 2022, however, the number of deaths have increased substantially, and there were 1,757 deaths in Queensland among people with COVID-19 from the start of the pandemic to a given date 31 January 2023.11
Additional information
Data and statistics
The visualisations below provides more detailed information for mortality.
Supplemental Figure S1: Mortality measures
Section technical notes
Where presented, ratios were calculated using higher precision estimates than those that are displayed within the report.
Unless otherwise stated, age-standardised rates were calculated by standardising to 2001 Australian standard population.
Death data for recent periods are preliminary and subject to change. Refer to Causes of Death, Australia on the Australian Bureau of Statistics website for further information.
References
- Australian Bureau of Statistics. 2022. Deaths, year of registration, summary data, sex, states, territories and australia.
- Queensland Health. 2021. Queensland Perinatal Statistics 2020. Brisbane.
- Australian Institute of Health and Welfare. 2022. Australia’s Mothers and Babies.
- Australian Bureau of Statistics. 2022. Deaths, year of registration, age at death, age-specific death rates, sex, states, territories and australia.
- Hugo Centre for Migration and Population Research. 2018. Accessibility/remoteness index of australia (ARIA).
- Australian Coordinating Registry. 2022. Cause of death unit record file.
- Australian Bureau of Statistics. 2022. Deaths, Australia 2021.
- Australian Institute of Health and Welfare. 2022. Mortality Over Regions and Time (MORT) books. doi: 10.25816/JJ1A-9Y78.
- Australian Institute of Health and Welfare. 2021. National healthcare agreement: PI 16potentially avoidable deaths, 2022.
- Australian Bureau of Statistics. 2022. Causes of Death, Australia, 2021. Canberra.
- Australian Bureau of Statistics. 2023. COVID-19 mortality in Australia: deaths registered until 31 January 2023. Canberra.