At a glance
For Queensland residents admitted to Queensland public and private hospitals:
- There were 2,857,614 admitted patient episodes of care in 2020–21.
- The standardised hospitalisations rate was 507.4 per 1,000 persons (479.5 per 1,000 for males and 537.1 per 1,000 for females).
- In the past two decades, age-standardised hospitalisation rates increased by 45% (350.1 to 507.4 per 1,000 persons in 2002–03 and 2020–21, respectively). This was driven by a 49% increase in adults 65 years and older (age-specific rate 946.0 and 1408.3 per 1,000 persons in 2002–03 and 2020–21, respectively). Increases varied by broad cause.
- In 2020–21, the hospitalisation rate for adults 65 and older was 2.3 times higher than in 46 to 64 years olds (age-specific rate 1408.3 and 620.9 per 1,000 persons, respectively).
- In remote and very remote areas, age-standardised hospitalisation rates were 22% higher than major cities (620.1 and 508.0 per 1,000 persons, respectively, in 2020–21). Age-standardised rates were 19% higher in the most disadvantaged compared to the most advantaged areas (564.2 and 473.7 per 1,000 persons, respectively, in 2020–21).
All cause hospitalisations
In 2020–21,
- There were 2,857,614 admitted patient episodes of care in Queensland acute public and private hospitals by Queensland residents—53.3% were for females.
- The age-standardised rate (ASR or standardised rate) was 507.4 per 1,000 for persons (537.1 for females and 479.5 for males). 1
Trends
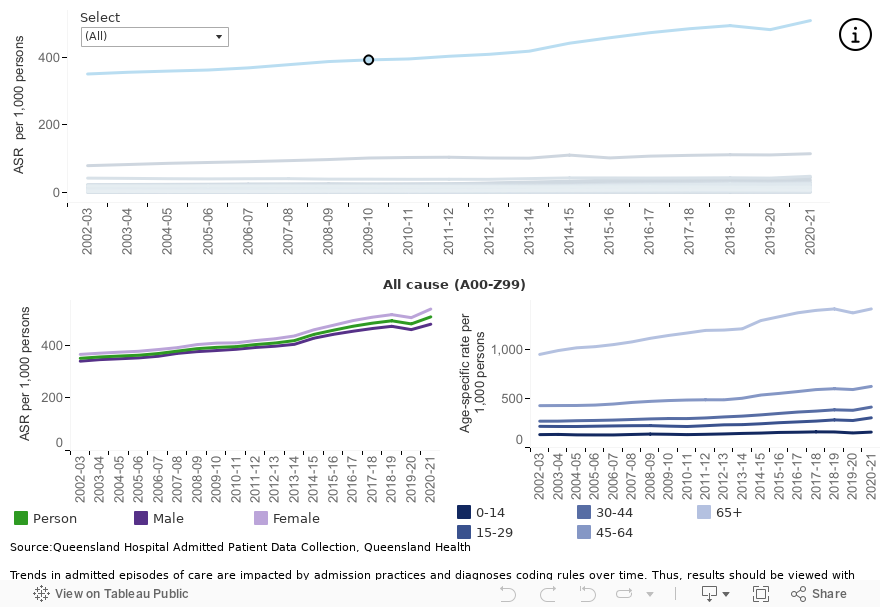
Standardised hospitalisation rates increased by 44.9%—from 350.1 per 1,000 persons in 2002–03 to 507.4 per 1,000 persons (Figure 1).
- Standardised rates increased every year except in 2019–20 when changes in admission practice and other public safety measures occurred in response to the COVID-19 pandemic.
- Rates increased most in older age groups—the age-specific rate for people 65 years and older increased from 946.0 per 1,000 persons in 2002–03 to 1408.3 per 1,000 persons in 2020–21.
Figure 1: Queensland trends in all cause hospitalisation rate


Ordered by age and sex
| Year | Sex | Age Group | Type | Rates (per 1,000 persons) |
|---|---|---|---|---|
| 2002-03 | Persons | 0-14 | Age Specific Rate | 130.9 |
| 2003-04 | Persons | 0-14 | Age Specific Rate | 132.9 |
| 2004-05 | Persons | 0-14 | Age Specific Rate | 128.3 |
| 2005-06 | Persons | 0-14 | Age Specific Rate | 127.7 |
| 2006-07 | Persons | 0-14 | Age Specific Rate | 127.5 |
| 2007-08 | Persons | 0-14 | Age Specific Rate | 132.2 |
| 2008-09 | Persons | 0-14 | Age Specific Rate | 136.5 |
| 2009-10 | Persons | 0-14 | Age Specific Rate | 134.3 |
| 2010-11 | Persons | 0-14 | Age Specific Rate | 130.9 |
| 2011-12 | Persons | 0-14 | Age Specific Rate | 134.0 |
| 2012-13 | Persons | 0-14 | Age Specific Rate | 137.8 |
| 2013-14 | Persons | 0-14 | Age Specific Rate | 143.1 |
| 2014-15 | Persons | 0-14 | Age Specific Rate | 146.5 |
| 2015-16 | Persons | 0-14 | Age Specific Rate | 153.1 |
| 2016-17 | Persons | 0-14 | Age Specific Rate | 155.3 |
| 2017-18 | Persons | 0-14 | Age Specific Rate | 158.9 |
| 2018-19 | Persons | 0-14 | Age Specific Rate | 158.1 |
| 2019-20 | Persons | 0-14 | Age Specific Rate | 147.9 |
| 2020-21 | Persons | 0-14 | Age Specific Rate | 156.5 |
| 2002-03 | Persons | 15-29 | Age Specific Rate | 215.0 |
| 2003-04 | Persons | 15-29 | Age Specific Rate | 213.7 |
| 2004-05 | Persons | 15-29 | Age Specific Rate | 213.5 |
| 2005-06 | Persons | 15-29 | Age Specific Rate | 216.4 |
| 2006-07 | Persons | 15-29 | Age Specific Rate | 219.3 |
| 2007-08 | Persons | 15-29 | Age Specific Rate | 221.6 |
| 2008-09 | Persons | 15-29 | Age Specific Rate | 222.4 |
| 2009-10 | Persons | 15-29 | Age Specific Rate | 217.1 |
| 2010-11 | Persons | 15-29 | Age Specific Rate | 213.3 |
| 2011-12 | Persons | 15-29 | Age Specific Rate | 221.6 |
| 2012-13 | Persons | 15-29 | Age Specific Rate | 230.4 |
| 2013-14 | Persons | 15-29 | Age Specific Rate | 232.5 |
| 2014-15 | Persons | 15-29 | Age Specific Rate | 241.1 |
| 2015-16 | Persons | 15-29 | Age Specific Rate | 252.0 |
| 2016-17 | Persons | 15-29 | Age Specific Rate | 260.2 |
| 2017-18 | Persons | 15-29 | Age Specific Rate | 268.3 |
| 2018-19 | Persons | 15-29 | Age Specific Rate | 280.2 |
| 2019-20 | Persons | 15-29 | Age Specific Rate | 274.2 |
| 2020-21 | Persons | 15-29 | Age Specific Rate | 301.8 |
| 2002-03 | Persons | 30-44 | Age Specific Rate | 267.5 |
| 2003-04 | Persons | 30-44 | Age Specific Rate | 267.8 |
| 2004-05 | Persons | 30-44 | Age Specific Rate | 272.2 |
| 2005-06 | Persons | 30-44 | Age Specific Rate | 274.8 |
| 2006-07 | Persons | 30-44 | Age Specific Rate | 278.7 |
| 2007-08 | Persons | 30-44 | Age Specific Rate | 284.5 |
| 2008-09 | Persons | 30-44 | Age Specific Rate | 290.5 |
| 2009-10 | Persons | 30-44 | Age Specific Rate | 294.5 |
| 2010-11 | Persons | 30-44 | Age Specific Rate | 293.9 |
| 2011-12 | Persons | 30-44 | Age Specific Rate | 300.4 |
| 2012-13 | Persons | 30-44 | Age Specific Rate | 310.7 |
| 2013-14 | Persons | 30-44 | Age Specific Rate | 319.0 |
| 2014-15 | Persons | 30-44 | Age Specific Rate | 331.4 |
| 2015-16 | Persons | 30-44 | Age Specific Rate | 346.2 |
| 2016-17 | Persons | 30-44 | Age Specific Rate | 360.2 |
| 2017-18 | Persons | 30-44 | Age Specific Rate | 369.9 |
| 2018-19 | Persons | 30-44 | Age Specific Rate | 382.7 |
| 2019-20 | Persons | 30-44 | Age Specific Rate | 377.9 |
| 2020-21 | Persons | 30-44 | Age Specific Rate | 410.6 |
| 2002-03 | Persons | 45-64 | Age Specific Rate | 425.2 |
| 2003-04 | Persons | 45-64 | Age Specific Rate | 426.4 |
| 2004-05 | Persons | 45-64 | Age Specific Rate | 427.0 |
| 2005-06 | Persons | 45-64 | Age Specific Rate | 431.2 |
| 2006-07 | Persons | 45-64 | Age Specific Rate | 441.8 |
| 2007-08 | Persons | 45-64 | Age Specific Rate | 457.8 |
| 2008-09 | Persons | 45-64 | Age Specific Rate | 468.8 |
| 2009-10 | Persons | 45-64 | Age Specific Rate | 477.1 |
| 2010-11 | Persons | 45-64 | Age Specific Rate | 482.5 |
| 2011-12 | Persons | 45-64 | Age Specific Rate | 484.9 |
| 2012-13 | Persons | 45-64 | Age Specific Rate | 484.6 |
| 2013-14 | Persons | 45-64 | Age Specific Rate | 500.6 |
| 2014-15 | Persons | 45-64 | Age Specific Rate | 533.1 |
| 2015-16 | Persons | 45-64 | Age Specific Rate | 549.8 |
| 2016-17 | Persons | 45-64 | Age Specific Rate | 568.5 |
| 2017-18 | Persons | 45-64 | Age Specific Rate | 588.6 |
| 2018-19 | Persons | 45-64 | Age Specific Rate | 597.5 |
| 2019-20 | Persons | 45-64 | Age Specific Rate | 589.0 |
| 2020-21 | Persons | 45-64 | Age Specific Rate | 620.9 |
| 2002-03 | Persons | 65+ | Age Specific Rate | 946.0 |
| 2003-04 | Persons | 65+ | Age Specific Rate | 985.1 |
| 2004-05 | Persons | 65+ | Age Specific Rate | 1,013.1 |
| 2005-06 | Persons | 65+ | Age Specific Rate | 1,024.8 |
| 2006-07 | Persons | 65+ | Age Specific Rate | 1,045.8 |
| 2007-08 | Persons | 65+ | Age Specific Rate | 1,073.2 |
| 2008-09 | Persons | 65+ | Age Specific Rate | 1,109.6 |
| 2009-10 | Persons | 65+ | Age Specific Rate | 1,138.8 |
| 2010-11 | Persons | 65+ | Age Specific Rate | 1,163.6 |
| 2011-12 | Persons | 65+ | Age Specific Rate | 1,190.0 |
| 2012-13 | Persons | 65+ | Age Specific Rate | 1,193.5 |
| 2013-14 | Persons | 65+ | Age Specific Rate | 1,206.4 |
| 2014-15 | Persons | 65+ | Age Specific Rate | 1,289.8 |
| 2015-16 | Persons | 65+ | Age Specific Rate | 1,329.3 |
| 2016-17 | Persons | 65+ | Age Specific Rate | 1,368.8 |
| 2017-18 | Persons | 65+ | Age Specific Rate | 1,393.6 |
| 2018-19 | Persons | 65+ | Age Specific Rate | 1,408.4 |
| 2019-20 | Persons | 65+ | Age Specific Rate | 1,367.9 |
| 2020-21 | Persons | 65+ | Age Specific Rate | 1,408.3 |
| 2002-03 | Males | 0-14 | Age Specific Rate | 147.4 |
| 2003-04 | Males | 0-14 | Age Specific Rate | 150.4 |
| 2004-05 | Males | 0-14 | Age Specific Rate | 145.1 |
| 2005-06 | Males | 0-14 | Age Specific Rate | 142.3 |
| 2006-07 | Males | 0-14 | Age Specific Rate | 142.3 |
| 2007-08 | Males | 0-14 | Age Specific Rate | 148.5 |
| 2008-09 | Males | 0-14 | Age Specific Rate | 152.1 |
| 2009-10 | Males | 0-14 | Age Specific Rate | 150.2 |
| 2010-11 | Males | 0-14 | Age Specific Rate | 144.6 |
| 2011-12 | Males | 0-14 | Age Specific Rate | 149.2 |
| 2012-13 | Males | 0-14 | Age Specific Rate | 154.1 |
| 2013-14 | Males | 0-14 | Age Specific Rate | 159.2 |
| 2014-15 | Males | 0-14 | Age Specific Rate | 161.9 |
| 2015-16 | Males | 0-14 | Age Specific Rate | 169.6 |
| 2016-17 | Males | 0-14 | Age Specific Rate | 172.9 |
| 2017-18 | Males | 0-14 | Age Specific Rate | 174.9 |
| 2018-19 | Males | 0-14 | Age Specific Rate | 174.5 |
| 2019-20 | Males | 0-14 | Age Specific Rate | 162.5 |
| 2020-21 | Males | 0-14 | Age Specific Rate | 170.7 |
| 2002-03 | Males | 15-29 | Age Specific Rate | 141.9 |
| 2003-04 | Males | 15-29 | Age Specific Rate | 139.8 |
| 2004-05 | Males | 15-29 | Age Specific Rate | 136.0 |
| 2005-06 | Males | 15-29 | Age Specific Rate | 136.9 |
| 2006-07 | Males | 15-29 | Age Specific Rate | 139.6 |
| 2007-08 | Males | 15-29 | Age Specific Rate | 142.0 |
| 2008-09 | Males | 15-29 | Age Specific Rate | 145.0 |
| 2009-10 | Males | 15-29 | Age Specific Rate | 140.2 |
| 2010-11 | Males | 15-29 | Age Specific Rate | 137.4 |
| 2011-12 | Males | 15-29 | Age Specific Rate | 140.8 |
| 2012-13 | Males | 15-29 | Age Specific Rate | 145.9 |
| 2013-14 | Males | 15-29 | Age Specific Rate | 146.9 |
| 2014-15 | Males | 15-29 | Age Specific Rate | 154.8 |
| 2015-16 | Males | 15-29 | Age Specific Rate | 164.5 |
| 2016-17 | Males | 15-29 | Age Specific Rate | 164.0 |
| 2017-18 | Males | 15-29 | Age Specific Rate | 165.4 |
| 2018-19 | Males | 15-29 | Age Specific Rate | 171.0 |
| 2019-20 | Males | 15-29 | Age Specific Rate | 165.4 |
| 2020-21 | Males | 15-29 | Age Specific Rate | 181.5 |
| 2002-03 | Males | 30-44 | Age Specific Rate | 200.1 |
| 2003-04 | Males | 30-44 | Age Specific Rate | 196.3 |
| 2004-05 | Males | 30-44 | Age Specific Rate | 195.3 |
| 2005-06 | Males | 30-44 | Age Specific Rate | 196.1 |
| 2006-07 | Males | 30-44 | Age Specific Rate | 196.8 |
| 2007-08 | Males | 30-44 | Age Specific Rate | 203.7 |
| 2008-09 | Males | 30-44 | Age Specific Rate | 205.6 |
| 2009-10 | Males | 30-44 | Age Specific Rate | 207.1 |
| 2010-11 | Males | 30-44 | Age Specific Rate | 210.5 |
| 2011-12 | Males | 30-44 | Age Specific Rate | 216.0 |
| 2012-13 | Males | 30-44 | Age Specific Rate | 224.3 |
| 2013-14 | Males | 30-44 | Age Specific Rate | 229.5 |
| 2014-15 | Males | 30-44 | Age Specific Rate | 240.2 |
| 2015-16 | Males | 30-44 | Age Specific Rate | 245.2 |
| 2016-17 | Males | 30-44 | Age Specific Rate | 254.0 |
| 2017-18 | Males | 30-44 | Age Specific Rate | 259.7 |
| 2018-19 | Males | 30-44 | Age Specific Rate | 264.4 |
| 2019-20 | Males | 30-44 | Age Specific Rate | 258.2 |
| 2020-21 | Males | 30-44 | Age Specific Rate | 277.9 |
| 2002-03 | Males | 45-64 | Age Specific Rate | 424.1 |
| 2003-04 | Males | 45-64 | Age Specific Rate | 428.4 |
| 2004-05 | Males | 45-64 | Age Specific Rate | 431.9 |
| 2005-06 | Males | 45-64 | Age Specific Rate | 438.1 |
| 2006-07 | Males | 45-64 | Age Specific Rate | 450.7 |
| 2007-08 | Males | 45-64 | Age Specific Rate | 469.8 |
| 2008-09 | Males | 45-64 | Age Specific Rate | 476.8 |
| 2009-10 | Males | 45-64 | Age Specific Rate | 485.7 |
| 2010-11 | Males | 45-64 | Age Specific Rate | 491.0 |
| 2011-12 | Males | 45-64 | Age Specific Rate | 493.2 |
| 2012-13 | Males | 45-64 | Age Specific Rate | 490.7 |
| 2013-14 | Males | 45-64 | Age Specific Rate | 500.0 |
| 2014-15 | Males | 45-64 | Age Specific Rate | 532.8 |
| 2015-16 | Males | 45-64 | Age Specific Rate | 547.1 |
| 2016-17 | Males | 45-64 | Age Specific Rate | 565.3 |
| 2017-18 | Males | 45-64 | Age Specific Rate | 587.4 |
| 2018-19 | Males | 45-64 | Age Specific Rate | 597.7 |
| 2019-20 | Males | 45-64 | Age Specific Rate | 589.8 |
| 2020-21 | Males | 45-64 | Age Specific Rate | 619.7 |
| 2002-03 | Males | 65+ | Age Specific Rate | 1,057.8 |
| 2003-04 | Males | 65+ | Age Specific Rate | 1,101.5 |
| 2004-05 | Males | 65+ | Age Specific Rate | 1,141.3 |
| 2005-06 | Males | 65+ | Age Specific Rate | 1,160.4 |
| 2006-07 | Males | 65+ | Age Specific Rate | 1,182.9 |
| 2007-08 | Males | 65+ | Age Specific Rate | 1,215.3 |
| 2008-09 | Males | 65+ | Age Specific Rate | 1,242.3 |
| 2009-10 | Males | 65+ | Age Specific Rate | 1,265.8 |
| 2010-11 | Males | 65+ | Age Specific Rate | 1,299.6 |
| 2011-12 | Males | 65+ | Age Specific Rate | 1,327.1 |
| 2012-13 | Males | 65+ | Age Specific Rate | 1,332.0 |
| 2013-14 | Males | 65+ | Age Specific Rate | 1,349.4 |
| 2014-15 | Males | 65+ | Age Specific Rate | 1,434.8 |
| 2015-16 | Males | 65+ | Age Specific Rate | 1,483.1 |
| 2016-17 | Males | 65+ | Age Specific Rate | 1,522.4 |
| 2017-18 | Males | 65+ | Age Specific Rate | 1,555.5 |
| 2018-19 | Males | 65+ | Age Specific Rate | 1,586.5 |
| 2019-20 | Males | 65+ | Age Specific Rate | 1,548.3 |
| 2020-21 | Males | 65+ | Age Specific Rate | 1,586.9 |
| 2002-03 | Females | 0-14 | Age Specific Rate | 113.5 |
| 2003-04 | Females | 0-14 | Age Specific Rate | 114.4 |
| 2004-05 | Females | 0-14 | Age Specific Rate | 110.7 |
| 2005-06 | Females | 0-14 | Age Specific Rate | 112.2 |
| 2006-07 | Females | 0-14 | Age Specific Rate | 111.9 |
| 2007-08 | Females | 0-14 | Age Specific Rate | 115.0 |
| 2008-09 | Females | 0-14 | Age Specific Rate | 120.1 |
| 2009-10 | Females | 0-14 | Age Specific Rate | 117.6 |
| 2010-11 | Females | 0-14 | Age Specific Rate | 116.3 |
| 2011-12 | Females | 0-14 | Age Specific Rate | 118.0 |
| 2012-13 | Females | 0-14 | Age Specific Rate | 120.7 |
| 2013-14 | Females | 0-14 | Age Specific Rate | 126.0 |
| 2014-15 | Females | 0-14 | Age Specific Rate | 130.3 |
| 2015-16 | Females | 0-14 | Age Specific Rate | 135.7 |
| 2016-17 | Females | 0-14 | Age Specific Rate | 136.9 |
| 2017-18 | Females | 0-14 | Age Specific Rate | 142.0 |
| 2018-19 | Females | 0-14 | Age Specific Rate | 140.7 |
| 2019-20 | Females | 0-14 | Age Specific Rate | 132.4 |
| 2020-21 | Females | 0-14 | Age Specific Rate | 141.5 |
| 2002-03 | Females | 15-29 | Age Specific Rate | 289.7 |
| 2003-04 | Females | 15-29 | Age Specific Rate | 289.1 |
| 2004-05 | Females | 15-29 | Age Specific Rate | 292.9 |
| 2005-06 | Females | 15-29 | Age Specific Rate | 298.1 |
| 2006-07 | Females | 15-29 | Age Specific Rate | 301.5 |
| 2007-08 | Females | 15-29 | Age Specific Rate | 303.7 |
| 2008-09 | Females | 15-29 | Age Specific Rate | 302.5 |
| 2009-10 | Females | 15-29 | Age Specific Rate | 297.0 |
| 2010-11 | Females | 15-29 | Age Specific Rate | 291.9 |
| 2011-12 | Females | 15-29 | Age Specific Rate | 304.9 |
| 2012-13 | Females | 15-29 | Age Specific Rate | 317.2 |
| 2013-14 | Females | 15-29 | Age Specific Rate | 320.4 |
| 2014-15 | Females | 15-29 | Age Specific Rate | 329.5 |
| 2015-16 | Females | 15-29 | Age Specific Rate | 341.5 |
| 2016-17 | Females | 15-29 | Age Specific Rate | 358.0 |
| 2017-18 | Females | 15-29 | Age Specific Rate | 373.3 |
| 2018-19 | Females | 15-29 | Age Specific Rate | 391.1 |
| 2019-20 | Females | 15-29 | Age Specific Rate | 384.7 |
| 2020-21 | Females | 15-29 | Age Specific Rate | 424.0 |
| 2002-03 | Females | 30-44 | Age Specific Rate | 333.1 |
| 2003-04 | Females | 30-44 | Age Specific Rate | 337.4 |
| 2004-05 | Females | 30-44 | Age Specific Rate | 347.3 |
| 2005-06 | Females | 30-44 | Age Specific Rate | 351.9 |
| 2006-07 | Females | 30-44 | Age Specific Rate | 359.3 |
| 2007-08 | Females | 30-44 | Age Specific Rate | 364.1 |
| 2008-09 | Females | 30-44 | Age Specific Rate | 374.2 |
| 2009-10 | Females | 30-44 | Age Specific Rate | 380.7 |
| 2010-11 | Females | 30-44 | Age Specific Rate | 376.2 |
| 2011-12 | Females | 30-44 | Age Specific Rate | 383.7 |
| 2012-13 | Females | 30-44 | Age Specific Rate | 396.0 |
| 2013-14 | Females | 30-44 | Age Specific Rate | 407.5 |
| 2014-15 | Females | 30-44 | Age Specific Rate | 421.2 |
| 2015-16 | Females | 30-44 | Age Specific Rate | 445.1 |
| 2016-17 | Females | 30-44 | Age Specific Rate | 463.5 |
| 2017-18 | Females | 30-44 | Age Specific Rate | 476.8 |
| 2018-19 | Females | 30-44 | Age Specific Rate | 496.7 |
| 2019-20 | Females | 30-44 | Age Specific Rate | 492.8 |
| 2020-21 | Females | 30-44 | Age Specific Rate | 537.4 |
| 2002-03 | Females | 45-64 | Age Specific Rate | 426.4 |
| 2003-04 | Females | 45-64 | Age Specific Rate | 424.5 |
| 2004-05 | Females | 45-64 | Age Specific Rate | 422.0 |
| 2005-06 | Females | 45-64 | Age Specific Rate | 424.2 |
| 2006-07 | Females | 45-64 | Age Specific Rate | 432.8 |
| 2007-08 | Females | 45-64 | Age Specific Rate | 445.9 |
| 2008-09 | Females | 45-64 | Age Specific Rate | 460.8 |
| 2009-10 | Females | 45-64 | Age Specific Rate | 468.5 |
| 2010-11 | Females | 45-64 | Age Specific Rate | 474.0 |
| 2011-12 | Females | 45-64 | Age Specific Rate | 476.6 |
| 2012-13 | Females | 45-64 | Age Specific Rate | 478.6 |
| 2013-14 | Females | 45-64 | Age Specific Rate | 501.2 |
| 2014-15 | Females | 45-64 | Age Specific Rate | 533.4 |
| 2015-16 | Females | 45-64 | Age Specific Rate | 552.3 |
| 2016-17 | Females | 45-64 | Age Specific Rate | 571.6 |
| 2017-18 | Females | 45-64 | Age Specific Rate | 589.7 |
| 2018-19 | Females | 45-64 | Age Specific Rate | 597.3 |
| 2019-20 | Females | 45-64 | Age Specific Rate | 588.3 |
| 2020-21 | Females | 45-64 | Age Specific Rate | 622.0 |
| 2002-03 | Females | 65+ | Age Specific Rate | 852.3 |
| 2003-04 | Females | 65+ | Age Specific Rate | 886.7 |
| 2004-05 | Females | 65+ | Age Specific Rate | 904.2 |
| 2005-06 | Females | 65+ | Age Specific Rate | 908.7 |
| 2006-07 | Females | 65+ | Age Specific Rate | 927.7 |
| 2007-08 | Females | 65+ | Age Specific Rate | 950.1 |
| 2008-09 | Females | 65+ | Age Specific Rate | 994.0 |
| 2009-10 | Females | 65+ | Age Specific Rate | 1,027.6 |
| 2010-11 | Females | 65+ | Age Specific Rate | 1,043.7 |
| 2011-12 | Females | 65+ | Age Specific Rate | 1,068.5 |
| 2012-13 | Females | 65+ | Age Specific Rate | 1,070.0 |
| 2013-14 | Females | 65+ | Age Specific Rate | 1,078.2 |
| 2014-15 | Females | 65+ | Age Specific Rate | 1,159.3 |
| 2015-16 | Females | 65+ | Age Specific Rate | 1,190.4 |
| 2016-17 | Females | 65+ | Age Specific Rate | 1,229.7 |
| 2017-18 | Females | 65+ | Age Specific Rate | 1,246.7 |
| 2018-19 | Females | 65+ | Age Specific Rate | 1,246.7 |
| 2019-20 | Females | 65+ | Age Specific Rate | 1,204.3 |
| 2020-21 | Females | 65+ | Age Specific Rate | 1,246.5 |
| 2002-03 | Persons | Total | Age Standardised Rate | 350.1 |
| 2003-04 | Persons | Total | Age Standardised Rate | 355.2 |
| 2004-05 | Persons | Total | Age Standardised Rate | 358.7 |
| 2005-06 | Persons | Total | Age Standardised Rate | 361.8 |
| 2006-07 | Persons | Total | Age Standardised Rate | 368.2 |
| 2007-08 | Persons | Total | Age Standardised Rate | 377.5 |
| 2008-09 | Persons | Total | Age Standardised Rate | 386.7 |
| 2009-10 | Persons | Total | Age Standardised Rate | 391.6 |
| 2010-11 | Persons | Total | Age Standardised Rate | 394.4 |
| 2011-12 | Persons | Total | Age Standardised Rate | 402.3 |
| 2012-13 | Persons | Total | Age Standardised Rate | 408.1 |
| 2013-14 | Persons | Total | Age Standardised Rate | 417.3 |
| 2014-15 | Persons | Total | Age Standardised Rate | 440.8 |
| 2015-16 | Persons | Total | Age Standardised Rate | 456.8 |
| 2016-17 | Persons | Total | Age Standardised Rate | 471.7 |
| 2017-18 | Persons | Total | Age Standardised Rate | 483.5 |
| 2018-19 | Persons | Total | Age Standardised Rate | 492.6 |
| 2019-20 | Persons | Total | Age Standardised Rate | 480.7 |
| 2020-21 | Persons | Total | Age Standardised Rate | 507.4 |
| 2002-03 | Males | Total | Age Standardised Rate | 339.2 |
| 2003-04 | Males | Total | Age Standardised Rate | 345.1 |
| 2004-05 | Males | Total | Age Standardised Rate | 348.3 |
| 2005-06 | Males | Total | Age Standardised Rate | 351.7 |
| 2006-07 | Males | Total | Age Standardised Rate | 357.8 |
| 2007-08 | Males | Total | Age Standardised Rate | 368.9 |
| 2008-09 | Males | Total | Age Standardised Rate | 375.5 |
| 2009-10 | Males | Total | Age Standardised Rate | 379.7 |
| 2010-11 | Males | Total | Age Standardised Rate | 384.3 |
| 2011-12 | Males | Total | Age Standardised Rate | 391.2 |
| 2012-13 | Males | Total | Age Standardised Rate | 395.9 |
| 2013-14 | Males | Total | Age Standardised Rate | 403.2 |
| 2014-15 | Males | Total | Age Standardised Rate | 426.5 |
| 2015-16 | Males | Total | Age Standardised Rate | 441.1 |
| 2016-17 | Males | Total | Age Standardised Rate | 452.8 |
| 2017-18 | Males | Total | Age Standardised Rate | 463.2 |
| 2018-19 | Males | Total | Age Standardised Rate | 471.6 |
| 2019-20 | Males | Total | Age Standardised Rate | 459.0 |
| 2020-21 | Males | Total | Age Standardised Rate | 479.5 |
| 2002-03 | Females | Total | Age Standardised Rate | 364.9 |
| 2003-04 | Females | Total | Age Standardised Rate | 369.5 |
| 2004-05 | Females | Total | Age Standardised Rate | 373.4 |
| 2005-06 | Females | Total | Age Standardised Rate | 376.8 |
| 2006-07 | Females | Total | Age Standardised Rate | 383.3 |
| 2007-08 | Females | Total | Age Standardised Rate | 390.7 |
| 2008-09 | Females | Total | Age Standardised Rate | 402.3 |
| 2009-10 | Females | Total | Age Standardised Rate | 407.8 |
| 2010-11 | Females | Total | Age Standardised Rate | 408.7 |
| 2011-12 | Females | Total | Age Standardised Rate | 417.5 |
| 2012-13 | Females | Total | Age Standardised Rate | 424.2 |
| 2013-14 | Females | Total | Age Standardised Rate | 435.0 |
| 2014-15 | Females | Total | Age Standardised Rate | 458.4 |
| 2015-16 | Females | Total | Age Standardised Rate | 475.6 |
| 2016-17 | Females | Total | Age Standardised Rate | 493.2 |
| 2017-18 | Females | Total | Age Standardised Rate | 506.2 |
| 2018-19 | Females | Total | Age Standardised Rate | 515.9 |
| 2019-20 | Females | Total | Age Standardised Rate | 504.5 |
| 2020-21 | Females | Total | Age Standardised Rate | 537.1 |
Broad causes of hospitalisations
Admitted patient episodes of care are coded using the International Statistical Classification of Diseases and Related Health Problems, Tenth Revision, Australian Modification (ICD-10-AM).2 ICD codes divide diseases and health conditions into similar categories (ICD chapters) based on the type of disease, the body systems affected, or the circumstances that caused the condition. While changes to ICD coding over time affect the interpretability of the results, understanding admission patterns by ICD chapters provides insights into the broad reasons why people are hospitalised.
Based on principal diagnosis, standardised rates for:
- Factors influencing health status and contact with health services, which includes admissions for routine therapy such as dialysis and chemotherapy, are the most common type for males and females (Figure 2). Repeated hospital admissions for routine therapy are often required for chronic conditions which, in part, contributes to increasing admission rates.
- People 65 years and older have the highest age-specific rate for these types of admissions and most admissions included in other ICD chapters. Exceptions include those related to childbirth, congenital abnormalities and mental health conditions.
Figure 2: Queensland hospital admission rates by ICD chapter, 2020–21


| Sex | Condition | Age Group | Type | Rates (per 1,000 persons) |
|---|---|---|---|---|
| Persons | A00 - B99 Infectious and parasitic diseases | 0-14 | Age Specific Rate | 7.7 |
| Persons | A00 - B99 Infectious and parasitic diseases | 15-29 | Age Specific Rate | 4.7 |
| Persons | A00 - B99 Infectious and parasitic diseases | 30-44 | Age Specific Rate | 5.0 |
| Persons | A00 - B99 Infectious and parasitic diseases | 45-64 | Age Specific Rate | 7.0 |
| Persons | A00 - B99 Infectious and parasitic diseases | 65+ | Age Specific Rate | 18.8 |
| Males | A00 - B99 Infectious and parasitic diseases | 0-14 | Age Specific Rate | 8.0 |
| Males | A00 - B99 Infectious and parasitic diseases | 15-29 | Age Specific Rate | 3.7 |
| Males | A00 - B99 Infectious and parasitic diseases | 30-44 | Age Specific Rate | 4.3 |
| Males | A00 - B99 Infectious and parasitic diseases | 45-64 | Age Specific Rate | 6.7 |
| Males | A00 - B99 Infectious and parasitic diseases | 65+ | Age Specific Rate | 19.6 |
| Females | A00 - B99 Infectious and parasitic diseases | 0-14 | Age Specific Rate | 7.4 |
| Females | A00 - B99 Infectious and parasitic diseases | 15-29 | Age Specific Rate | 5.7 |
| Females | A00 - B99 Infectious and parasitic diseases | 30-44 | Age Specific Rate | 5.6 |
| Females | A00 - B99 Infectious and parasitic diseases | 45-64 | Age Specific Rate | 7.3 |
| Females | A00 - B99 Infectious and parasitic diseases | 65+ | Age Specific Rate | 18.1 |
| Persons | A00 - B99 Infectious and parasitic diseases | Total | Age Standardised Rate | 7.7 |
| Males | A00 - B99 Infectious and parasitic diseases | Total | Age Standardised Rate | 7.5 |
| Females | A00 - B99 Infectious and parasitic diseases | Total | Age Standardised Rate | 7.9 |
| Persons | A00 - B99 Infectious and parasitic diseases | Total | Crude Rate | 8.2 |
| Males | A00 - B99 Infectious and parasitic diseases | Total | Crude Rate | 7.9 |
| Females | A00 - B99 Infectious and parasitic diseases | Total | Crude Rate | 8.4 |
| Persons | C00 - C97 Malignant neoplasms | 0-14 | Age Specific Rate | 1.4 |
| Persons | C00 - C97 Malignant neoplasms | 15-29 | Age Specific Rate | 1.2 |
| Persons | C00 - C97 Malignant neoplasms | 30-44 | Age Specific Rate | 5.0 |
| Persons | C00 - C97 Malignant neoplasms | 45-64 | Age Specific Rate | 24.7 |
| Persons | C00 - C97 Malignant neoplasms | 65+ | Age Specific Rate | 81.5 |
| Males | C00 - C97 Malignant neoplasms | 0-14 | Age Specific Rate | 1.5 |
| Males | C00 - C97 Malignant neoplasms | 15-29 | Age Specific Rate | 1.3 |
| Males | C00 - C97 Malignant neoplasms | 30-44 | Age Specific Rate | 4.2 |
| Males | C00 - C97 Malignant neoplasms | 45-64 | Age Specific Rate | 27.1 |
| Males | C00 - C97 Malignant neoplasms | 65+ | Age Specific Rate | 105.5 |
| Females | C00 - C97 Malignant neoplasms | 0-14 | Age Specific Rate | 1.3 |
| Females | C00 - C97 Malignant neoplasms | 15-29 | Age Specific Rate | 1.1 |
| Females | C00 - C97 Malignant neoplasms | 30-44 | Age Specific Rate | 5.8 |
| Females | C00 - C97 Malignant neoplasms | 45-64 | Age Specific Rate | 22.5 |
| Females | C00 - C97 Malignant neoplasms | 65+ | Age Specific Rate | 59.7 |
| Persons | C00 - C97 Malignant neoplasms | Total | Age Standardised Rate | 17.4 |
| Males | C00 - C97 Malignant neoplasms | Total | Age Standardised Rate | 20.9 |
| Females | C00 - C97 Malignant neoplasms | Total | Age Standardised Rate | 14.3 |
| Persons | C00 - C97 Malignant neoplasms | Total | Crude Rate | 20.7 |
| Males | C00 - C97 Malignant neoplasms | Total | Crude Rate | 24.3 |
| Females | C00 - C97 Malignant neoplasms | Total | Crude Rate | 17.2 |
| Persons | D00 - D48 Benign and other neoplasms | 0-14 | Age Specific Rate | 1.2 |
| Persons | D00 - D48 Benign and other neoplasms | 15-29 | Age Specific Rate | 2.7 |
| Persons | D00 - D48 Benign and other neoplasms | 30-44 | Age Specific Rate | 8.9 |
| Persons | D00 - D48 Benign and other neoplasms | 45-64 | Age Specific Rate | 20.0 |
| Persons | D00 - D48 Benign and other neoplasms | 65+ | Age Specific Rate | 45.0 |
| Males | D00 - D48 Benign and other neoplasms | 0-14 | Age Specific Rate | 1.2 |
| Males | D00 - D48 Benign and other neoplasms | 15-29 | Age Specific Rate | 1.1 |
| Males | D00 - D48 Benign and other neoplasms | 30-44 | Age Specific Rate | 5.0 |
| Males | D00 - D48 Benign and other neoplasms | 45-64 | Age Specific Rate | 19.2 |
| Males | D00 - D48 Benign and other neoplasms | 65+ | Age Specific Rate | 54.3 |
| Females | D00 - D48 Benign and other neoplasms | 0-14 | Age Specific Rate | 1.3 |
| Females | D00 - D48 Benign and other neoplasms | 15-29 | Age Specific Rate | 4.3 |
| Females | D00 - D48 Benign and other neoplasms | 30-44 | Age Specific Rate | 12.6 |
| Females | D00 - D48 Benign and other neoplasms | 45-64 | Age Specific Rate | 20.7 |
| Females | D00 - D48 Benign and other neoplasms | 65+ | Age Specific Rate | 36.6 |
| Persons | D00 - D48 Benign and other neoplasms | Total | Age Standardised Rate | 13.0 |
| Males | D00 - D48 Benign and other neoplasms | Total | Age Standardised Rate | 12.7 |
| Females | D00 - D48 Benign and other neoplasms | Total | Age Standardised Rate | 13.4 |
| Persons | D00 - D48 Benign and other neoplasms | Total | Crude Rate | 14.7 |
| Males | D00 - D48 Benign and other neoplasms | Total | Crude Rate | 14.5 |
| Females | D00 - D48 Benign and other neoplasms | Total | Crude Rate | 14.9 |
| Persons | D50 - D89 Diseases of blood and blood forming organs etc | 0-14 | Age Specific Rate | 1.6 |
| Persons | D50 - D89 Diseases of blood and blood forming organs etc | 15-29 | Age Specific Rate | 3.2 |
| Persons | D50 - D89 Diseases of blood and blood forming organs etc | 30-44 | Age Specific Rate | 5.4 |
| Persons | D50 - D89 Diseases of blood and blood forming organs etc | 45-64 | Age Specific Rate | 11.1 |
| Persons | D50 - D89 Diseases of blood and blood forming organs etc | 65+ | Age Specific Rate | 37.8 |
| Males | D50 - D89 Diseases of blood and blood forming organs etc | 0-14 | Age Specific Rate | 1.6 |
| Males | D50 - D89 Diseases of blood and blood forming organs etc | 15-29 | Age Specific Rate | 2.4 |
| Males | D50 - D89 Diseases of blood and blood forming organs etc | 30-44 | Age Specific Rate | 3.3 |
| Males | D50 - D89 Diseases of blood and blood forming organs etc | 45-64 | Age Specific Rate | 9.6 |
| Males | D50 - D89 Diseases of blood and blood forming organs etc | 65+ | Age Specific Rate | 40.1 |
| Females | D50 - D89 Diseases of blood and blood forming organs etc | 0-14 | Age Specific Rate | 1.6 |
| Females | D50 - D89 Diseases of blood and blood forming organs etc | 15-29 | Age Specific Rate | 4.0 |
| Females | D50 - D89 Diseases of blood and blood forming organs etc | 30-44 | Age Specific Rate | 7.4 |
| Females | D50 - D89 Diseases of blood and blood forming organs etc | 45-64 | Age Specific Rate | 12.6 |
| Females | D50 - D89 Diseases of blood and blood forming organs etc | 65+ | Age Specific Rate | 35.7 |
| Persons | D50 - D89 Diseases of blood and blood forming organs etc | Total | Age Standardised Rate | 9.6 |
| Males | D50 - D89 Diseases of blood and blood forming organs etc | Total | Age Standardised Rate | 8.9 |
| Females | D50 - D89 Diseases of blood and blood forming organs etc | Total | Age Standardised Rate | 10.2 |
| Persons | D50 - D89 Diseases of blood and blood forming organs etc | Total | Crude Rate | 10.8 |
| Males | D50 - D89 Diseases of blood and blood forming organs etc | Total | Crude Rate | 10.0 |
| Females | D50 - D89 Diseases of blood and blood forming organs etc | Total | Crude Rate | 11.7 |
| Persons | E00 - E89/E90 Endocrine, nutritional and metabolic disorders including diabetes | 0-14 | Age Specific Rate | 2.7 |
| Persons | E00 - E89/E90 Endocrine, nutritional and metabolic disorders including diabetes | 15-29 | Age Specific Rate | 5.5 |
| Persons | E00 - E89/E90 Endocrine, nutritional and metabolic disorders including diabetes | 30-44 | Age Specific Rate | 9.5 |
| Persons | E00 - E89/E90 Endocrine, nutritional and metabolic disorders including diabetes | 45-64 | Age Specific Rate | 13.7 |
| Persons | E00 - E89/E90 Endocrine, nutritional and metabolic disorders including diabetes | 65+ | Age Specific Rate | 21.6 |
| Males | E00 - E89/E90 Endocrine, nutritional and metabolic disorders including diabetes | 0-14 | Age Specific Rate | 2.7 |
| Males | E00 - E89/E90 Endocrine, nutritional and metabolic disorders including diabetes | 15-29 | Age Specific Rate | 2.7 |
| Males | E00 - E89/E90 Endocrine, nutritional and metabolic disorders including diabetes | 30-44 | Age Specific Rate | 5.1 |
| Males | E00 - E89/E90 Endocrine, nutritional and metabolic disorders including diabetes | 45-64 | Age Specific Rate | 11.2 |
| Males | E00 - E89/E90 Endocrine, nutritional and metabolic disorders including diabetes | 65+ | Age Specific Rate | 23.6 |
| Females | E00 - E89/E90 Endocrine, nutritional and metabolic disorders including diabetes | 0-14 | Age Specific Rate | 2.7 |
| Females | E00 - E89/E90 Endocrine, nutritional and metabolic disorders including diabetes | 15-29 | Age Specific Rate | 8.3 |
| Females | E00 - E89/E90 Endocrine, nutritional and metabolic disorders including diabetes | 30-44 | Age Specific Rate | 13.8 |
| Females | E00 - E89/E90 Endocrine, nutritional and metabolic disorders including diabetes | 45-64 | Age Specific Rate | 16.0 |
| Females | E00 - E89/E90 Endocrine, nutritional and metabolic disorders including diabetes | 65+ | Age Specific Rate | 19.9 |
| Persons | E00 - E89/E90 Endocrine, nutritional and metabolic disorders including diabetes | Total | Age Standardised Rate | 9.8 |
| Males | E00 - E89/E90 Endocrine, nutritional and metabolic disorders including diabetes | Total | Age Standardised Rate | 7.9 |
| Females | E00 - E89/E90 Endocrine, nutritional and metabolic disorders including diabetes | Total | Age Standardised Rate | 11.7 |
| Persons | E00 - E89/E90 Endocrine, nutritional and metabolic disorders including diabetes | Total | Crude Rate | 10.4 |
| Males | E00 - E89/E90 Endocrine, nutritional and metabolic disorders including diabetes | Total | Crude Rate | 8.5 |
| Females | E00 - E89/E90 Endocrine, nutritional and metabolic disorders including diabetes | Total | Crude Rate | 12.2 |
| Persons | F00 - F99 Mental and behavioural disorders | 0-14 | Age Specific Rate | 1.9 |
| Persons | F00 - F99 Mental and behavioural disorders | 15-29 | Age Specific Rate | 28.4 |
| Persons | F00 - F99 Mental and behavioural disorders | 30-44 | Age Specific Rate | 36.0 |
| Persons | F00 - F99 Mental and behavioural disorders | 45-64 | Age Specific Rate | 35.1 |
| Persons | F00 - F99 Mental and behavioural disorders | 65+ | Age Specific Rate | 33.5 |
| Males | F00 - F99 Mental and behavioural disorders | 0-14 | Age Specific Rate | 1.3 |
| Males | F00 - F99 Mental and behavioural disorders | 15-29 | Age Specific Rate | 18.8 |
| Males | F00 - F99 Mental and behavioural disorders | 30-44 | Age Specific Rate | 31.6 |
| Males | F00 - F99 Mental and behavioural disorders | 45-64 | Age Specific Rate | 30.1 |
| Males | F00 - F99 Mental and behavioural disorders | 65+ | Age Specific Rate | 31.0 |
| Females | F00 - F99 Mental and behavioural disorders | 0-14 | Age Specific Rate | 2.5 |
| Females | F00 - F99 Mental and behavioural disorders | 15-29 | Age Specific Rate | 38.2 |
| Females | F00 - F99 Mental and behavioural disorders | 30-44 | Age Specific Rate | 40.2 |
| Females | F00 - F99 Mental and behavioural disorders | 45-64 | Age Specific Rate | 39.9 |
| Females | F00 - F99 Mental and behavioural disorders | 65+ | Age Specific Rate | 35.7 |
| Persons | F00 - F99 Mental and behavioural disorders | Total | Age Standardised Rate | 27.0 |
| Males | F00 - F99 Mental and behavioural disorders | Total | Age Standardised Rate | 22.5 |
| Females | F00 - F99 Mental and behavioural disorders | Total | Age Standardised Rate | 31.5 |
| Persons | F00 - F99 Mental and behavioural disorders | Total | Crude Rate | 27.3 |
| Males | F00 - F99 Mental and behavioural disorders | Total | Crude Rate | 22.5 |
| Females | F00 - F99 Mental and behavioural disorders | Total | Crude Rate | 32.0 |
| Persons | G00 - G99 Nervous system and sense organ disorders | 0-14 | Age Specific Rate | 6.1 |
| Persons | G00 - G99 Nervous system and sense organ disorders | 15-29 | Age Specific Rate | 7.0 |
| Persons | G00 - G99 Nervous system and sense organ disorders | 30-44 | Age Specific Rate | 12.3 |
| Persons | G00 - G99 Nervous system and sense organ disorders | 45-64 | Age Specific Rate | 22.0 |
| Persons | G00 - G99 Nervous system and sense organ disorders | 65+ | Age Specific Rate | 38.4 |
| Males | G00 - G99 Nervous system and sense organ disorders | 0-14 | Age Specific Rate | 6.4 |
| Males | G00 - G99 Nervous system and sense organ disorders | 15-29 | Age Specific Rate | 5.4 |
| Males | G00 - G99 Nervous system and sense organ disorders | 30-44 | Age Specific Rate | 9.8 |
| Males | G00 - G99 Nervous system and sense organ disorders | 45-64 | Age Specific Rate | 20.8 |
| Males | G00 - G99 Nervous system and sense organ disorders | 65+ | Age Specific Rate | 46.2 |
| Females | G00 - G99 Nervous system and sense organ disorders | 0-14 | Age Specific Rate | 5.7 |
| Females | G00 - G99 Nervous system and sense organ disorders | 15-29 | Age Specific Rate | 8.7 |
| Females | G00 - G99 Nervous system and sense organ disorders | 30-44 | Age Specific Rate | 14.7 |
| Females | G00 - G99 Nervous system and sense organ disorders | 45-64 | Age Specific Rate | 23.1 |
| Females | G00 - G99 Nervous system and sense organ disorders | 65+ | Age Specific Rate | 31.3 |
| Persons | G00 - G99 Nervous system and sense organ disorders | Total | Age Standardised Rate | 15.4 |
| Males | G00 - G99 Nervous system and sense organ disorders | Total | Age Standardised Rate | 15.3 |
| Females | G00 - G99 Nervous system and sense organ disorders | Total | Age Standardised Rate | 15.6 |
| Persons | G00 - G99 Nervous system and sense organ disorders | Total | Crude Rate | 16.6 |
| Males | G00 - G99 Nervous system and sense organ disorders | Total | Crude Rate | 16.5 |
| Females | G00 - G99 Nervous system and sense organ disorders | Total | Crude Rate | 16.7 |
| Persons | H00 - H59 Diseases of eye and adnexa | 0-14 | Age Specific Rate | 1.5 |
| Persons | H00 - H59 Diseases of eye and adnexa | 15-29 | Age Specific Rate | 1.2 |
| Persons | H00 - H59 Diseases of eye and adnexa | 30-44 | Age Specific Rate | 2.7 |
| Persons | H00 - H59 Diseases of eye and adnexa | 45-64 | Age Specific Rate | 18.7 |
| Persons | H00 - H59 Diseases of eye and adnexa | 65+ | Age Specific Rate | 103.9 |
| Males | H00 - H59 Diseases of eye and adnexa | 0-14 | Age Specific Rate | 1.5 |
| Males | H00 - H59 Diseases of eye and adnexa | 15-29 | Age Specific Rate | 1.2 |
| Males | H00 - H59 Diseases of eye and adnexa | 30-44 | Age Specific Rate | 2.7 |
| Males | H00 - H59 Diseases of eye and adnexa | 45-64 | Age Specific Rate | 18.4 |
| Males | H00 - H59 Diseases of eye and adnexa | 65+ | Age Specific Rate | 101.4 |
| Females | H00 - H59 Diseases of eye and adnexa | 0-14 | Age Specific Rate | 1.4 |
| Females | H00 - H59 Diseases of eye and adnexa | 15-29 | Age Specific Rate | 1.3 |
| Females | H00 - H59 Diseases of eye and adnexa | 30-44 | Age Specific Rate | 2.7 |
| Females | H00 - H59 Diseases of eye and adnexa | 45-64 | Age Specific Rate | 18.9 |
| Females | H00 - H59 Diseases of eye and adnexa | 65+ | Age Specific Rate | 106.1 |
| Persons | H00 - H59 Diseases of eye and adnexa | Total | Age Standardised Rate | 18.5 |
| Males | H00 - H59 Diseases of eye and adnexa | Total | Age Standardised Rate | 18.3 |
| Females | H00 - H59 Diseases of eye and adnexa | Total | Age Standardised Rate | 18.7 |
| Persons | H00 - H59 Diseases of eye and adnexa | Total | Crude Rate | 22.4 |
| Males | H00 - H59 Diseases of eye and adnexa | Total | Crude Rate | 21.2 |
| Females | H00 - H59 Diseases of eye and adnexa | Total | Crude Rate | 23.5 |
| Persons | H60 - H95 Diseases of ear and mastoid process | 0-14 | Age Specific Rate | 4.5 |
| Persons | H60 - H95 Diseases of ear and mastoid process | 15-29 | Age Specific Rate | 1.4 |
| Persons | H60 - H95 Diseases of ear and mastoid process | 30-44 | Age Specific Rate | 2.2 |
| Persons | H60 - H95 Diseases of ear and mastoid process | 45-64 | Age Specific Rate | 3.6 |
| Persons | H60 - H95 Diseases of ear and mastoid process | 65+ | Age Specific Rate | 6.3 |
| Males | H60 - H95 Diseases of ear and mastoid process | 0-14 | Age Specific Rate | 5.4 |
| Males | H60 - H95 Diseases of ear and mastoid process | 15-29 | Age Specific Rate | 1.3 |
| Males | H60 - H95 Diseases of ear and mastoid process | 30-44 | Age Specific Rate | 1.9 |
| Males | H60 - H95 Diseases of ear and mastoid process | 45-64 | Age Specific Rate | 3.3 |
| Males | H60 - H95 Diseases of ear and mastoid process | 65+ | Age Specific Rate | 6.1 |
| Females | H60 - H95 Diseases of ear and mastoid process | 0-14 | Age Specific Rate | 3.6 |
| Females | H60 - H95 Diseases of ear and mastoid process | 15-29 | Age Specific Rate | 1.4 |
| Females | H60 - H95 Diseases of ear and mastoid process | 30-44 | Age Specific Rate | 2.4 |
| Females | H60 - H95 Diseases of ear and mastoid process | 45-64 | Age Specific Rate | 3.8 |
| Females | H60 - H95 Diseases of ear and mastoid process | 65+ | Age Specific Rate | 6.5 |
| Persons | H60 - H95 Diseases of ear and mastoid process | Total | Age Standardised Rate | 3.3 |
| Males | H60 - H95 Diseases of ear and mastoid process | Total | Age Standardised Rate | 3.4 |
| Females | H60 - H95 Diseases of ear and mastoid process | Total | Age Standardised Rate | 3.3 |
| Persons | H60 - H95 Diseases of ear and mastoid process | Total | Crude Rate | 3.5 |
| Males | H60 - H95 Diseases of ear and mastoid process | Total | Crude Rate | 3.5 |
| Females | H60 - H95 Diseases of ear and mastoid process | Total | Crude Rate | 3.5 |
| Persons | I00 - I99 Diseases of circulatory system | 0-14 | Age Specific Rate | 1.6 |
| Persons | I00 - I99 Diseases of circulatory system | 15-29 | Age Specific Rate | 2.8 |
| Persons | I00 - I99 Diseases of circulatory system | 30-44 | Age Specific Rate | 6.9 |
| Persons | I00 - I99 Diseases of circulatory system | 45-64 | Age Specific Rate | 27.8 |
| Persons | I00 - I99 Diseases of circulatory system | 65+ | Age Specific Rate | 109.1 |
| Males | I00 - I99 Diseases of circulatory system | 0-14 | Age Specific Rate | 1.6 |
| Males | I00 - I99 Diseases of circulatory system | 15-29 | Age Specific Rate | 3.0 |
| Males | I00 - I99 Diseases of circulatory system | 30-44 | Age Specific Rate | 7.4 |
| Males | I00 - I99 Diseases of circulatory system | 45-64 | Age Specific Rate | 36.2 |
| Males | I00 - I99 Diseases of circulatory system | 65+ | Age Specific Rate | 130.0 |
| Females | I00 - I99 Diseases of circulatory system | 0-14 | Age Specific Rate | 1.5 |
| Females | I00 - I99 Diseases of circulatory system | 15-29 | Age Specific Rate | 2.6 |
| Females | I00 - I99 Diseases of circulatory system | 30-44 | Age Specific Rate | 6.3 |
| Females | I00 - I99 Diseases of circulatory system | 45-64 | Age Specific Rate | 19.9 |
| Females | I00 - I99 Diseases of circulatory system | 65+ | Age Specific Rate | 90.2 |
| Persons | I00 - I99 Diseases of circulatory system | Total | Age Standardised Rate | 22.6 |
| Males | I00 - I99 Diseases of circulatory system | Total | Age Standardised Rate | 27.6 |
| Females | I00 - I99 Diseases of circulatory system | Total | Age Standardised Rate | 18.0 |
| Persons | I00 - I99 Diseases of circulatory system | Total | Crude Rate | 26.6 |
| Males | I00 - I99 Diseases of circulatory system | Total | Crude Rate | 31.3 |
| Females | I00 - I99 Diseases of circulatory system | Total | Crude Rate | 22.1 |
| Persons | J00 - J99 Diseases of respiratory system | 0-14 | Age Specific Rate | 26.3 |
| Persons | J00 - J99 Diseases of respiratory system | 15-29 | Age Specific Rate | 9.5 |
| Persons | J00 - J99 Diseases of respiratory system | 30-44 | Age Specific Rate | 9.0 |
| Persons | J00 - J99 Diseases of respiratory system | 45-64 | Age Specific Rate | 13.8 |
| Persons | J00 - J99 Diseases of respiratory system | 65+ | Age Specific Rate | 42.3 |
| Males | J00 - J99 Diseases of respiratory system | 0-14 | Age Specific Rate | 30.3 |
| Males | J00 - J99 Diseases of respiratory system | 15-29 | Age Specific Rate | 7.8 |
| Males | J00 - J99 Diseases of respiratory system | 30-44 | Age Specific Rate | 9.0 |
| Males | J00 - J99 Diseases of respiratory system | 45-64 | Age Specific Rate | 13.6 |
| Males | J00 - J99 Diseases of respiratory system | 65+ | Age Specific Rate | 46.8 |
| Females | J00 - J99 Diseases of respiratory system | 0-14 | Age Specific Rate | 22.1 |
| Females | J00 - J99 Diseases of respiratory system | 15-29 | Age Specific Rate | 11.3 |
| Females | J00 - J99 Diseases of respiratory system | 30-44 | Age Specific Rate | 9.0 |
| Females | J00 - J99 Diseases of respiratory system | 45-64 | Age Specific Rate | 14.0 |
| Females | J00 - J99 Diseases of respiratory system | 65+ | Age Specific Rate | 38.2 |
| Persons | J00 - J99 Diseases of respiratory system | Total | Age Standardised Rate | 18.0 |
| Males | J00 - J99 Diseases of respiratory system | Total | Age Standardised Rate | 19.2 |
| Females | J00 - J99 Diseases of respiratory system | Total | Age Standardised Rate | 17.0 |
| Persons | J00 - J99 Diseases of respiratory system | Total | Crude Rate | 19.0 |
| Males | J00 - J99 Diseases of respiratory system | Total | Crude Rate | 20.0 |
| Females | J00 - J99 Diseases of respiratory system | Total | Crude Rate | 18.0 |
| Persons | K00 - K93 Diseases of the digestive system | 0-14 | Age Specific Rate | 14.9 |
| Persons | K00 - K93 Diseases of the digestive system | 15-29 | Age Specific Rate | 36.6 |
| Persons | K00 - K93 Diseases of the digestive system | 30-44 | Age Specific Rate | 45.0 |
| Persons | K00 - K93 Diseases of the digestive system | 45-64 | Age Specific Rate | 67.7 |
| Persons | K00 - K93 Diseases of the digestive system | 65+ | Age Specific Rate | 99.0 |
| Males | K00 - K93 Diseases of the digestive system | 0-14 | Age Specific Rate | 15.7 |
| Males | K00 - K93 Diseases of the digestive system | 15-29 | Age Specific Rate | 30.4 |
| Males | K00 - K93 Diseases of the digestive system | 30-44 | Age Specific Rate | 43.9 |
| Males | K00 - K93 Diseases of the digestive system | 45-64 | Age Specific Rate | 68.8 |
| Males | K00 - K93 Diseases of the digestive system | 65+ | Age Specific Rate | 105.4 |
| Females | K00 - K93 Diseases of the digestive system | 0-14 | Age Specific Rate | 14.2 |
| Females | K00 - K93 Diseases of the digestive system | 15-29 | Age Specific Rate | 42.9 |
| Females | K00 - K93 Diseases of the digestive system | 30-44 | Age Specific Rate | 46.1 |
| Females | K00 - K93 Diseases of the digestive system | 45-64 | Age Specific Rate | 66.7 |
| Females | K00 - K93 Diseases of the digestive system | 65+ | Age Specific Rate | 93.2 |
| Persons | K00 - K93 Diseases of the digestive system | Total | Age Standardised Rate | 49.0 |
| Males | K00 - K93 Diseases of the digestive system | Total | Age Standardised Rate | 48.6 |
| Females | K00 - K93 Diseases of the digestive system | Total | Age Standardised Rate | 49.4 |
| Persons | K00 - K93 Diseases of the digestive system | Total | Crude Rate | 51.8 |
| Males | K00 - K93 Diseases of the digestive system | Total | Crude Rate | 51.1 |
| Females | K00 - K93 Diseases of the digestive system | Total | Crude Rate | 52.5 |
| Persons | L00 - L99 Diseases of skin and subcutaneous tissue | 0-14 | Age Specific Rate | 4.0 |
| Persons | L00 - L99 Diseases of skin and subcutaneous tissue | 15-29 | Age Specific Rate | 6.5 |
| Persons | L00 - L99 Diseases of skin and subcutaneous tissue | 30-44 | Age Specific Rate | 7.5 |
| Persons | L00 - L99 Diseases of skin and subcutaneous tissue | 45-64 | Age Specific Rate | 9.6 |
| Persons | L00 - L99 Diseases of skin and subcutaneous tissue | 65+ | Age Specific Rate | 18.1 |
| Males | L00 - L99 Diseases of skin and subcutaneous tissue | 0-14 | Age Specific Rate | 4.1 |
| Males | L00 - L99 Diseases of skin and subcutaneous tissue | 15-29 | Age Specific Rate | 7.2 |
| Males | L00 - L99 Diseases of skin and subcutaneous tissue | 30-44 | Age Specific Rate | 8.2 |
| Males | L00 - L99 Diseases of skin and subcutaneous tissue | 45-64 | Age Specific Rate | 9.9 |
| Males | L00 - L99 Diseases of skin and subcutaneous tissue | 65+ | Age Specific Rate | 19.9 |
| Females | L00 - L99 Diseases of skin and subcutaneous tissue | 0-14 | Age Specific Rate | 3.8 |
| Females | L00 - L99 Diseases of skin and subcutaneous tissue | 15-29 | Age Specific Rate | 5.8 |
| Females | L00 - L99 Diseases of skin and subcutaneous tissue | 30-44 | Age Specific Rate | 6.8 |
| Females | L00 - L99 Diseases of skin and subcutaneous tissue | 45-64 | Age Specific Rate | 9.3 |
| Females | L00 - L99 Diseases of skin and subcutaneous tissue | 65+ | Age Specific Rate | 16.4 |
| Persons | L00 - L99 Diseases of skin and subcutaneous tissue | Total | Age Standardised Rate | 8.4 |
| Males | L00 - L99 Diseases of skin and subcutaneous tissue | Total | Age Standardised Rate | 9.1 |
| Females | L00 - L99 Diseases of skin and subcutaneous tissue | Total | Age Standardised Rate | 7.7 |
| Persons | L00 - L99 Diseases of skin and subcutaneous tissue | Total | Crude Rate | 8.8 |
| Males | L00 - L99 Diseases of skin and subcutaneous tissue | Total | Crude Rate | 9.4 |
| Females | L00 - L99 Diseases of skin and subcutaneous tissue | Total | Crude Rate | 8.3 |
| Persons | M00 - M99 Diseases of musculoskeletal system and connective tissue | 0-14 | Age Specific Rate | 3.3 |
| Persons | M00 - M99 Diseases of musculoskeletal system and connective tissue | 15-29 | Age Specific Rate | 10.7 |
| Persons | M00 - M99 Diseases of musculoskeletal system and connective tissue | 30-44 | Age Specific Rate | 19.7 |
| Persons | M00 - M99 Diseases of musculoskeletal system and connective tissue | 45-64 | Age Specific Rate | 44.1 |
| Persons | M00 - M99 Diseases of musculoskeletal system and connective tissue | 65+ | Age Specific Rate | 96.1 |
| Males | M00 - M99 Diseases of musculoskeletal system and connective tissue | 0-14 | Age Specific Rate | 3.4 |
| Males | M00 - M99 Diseases of musculoskeletal system and connective tissue | 15-29 | Age Specific Rate | 11.9 |
| Males | M00 - M99 Diseases of musculoskeletal system and connective tissue | 30-44 | Age Specific Rate | 22.4 |
| Males | M00 - M99 Diseases of musculoskeletal system and connective tissue | 45-64 | Age Specific Rate | 44.7 |
| Males | M00 - M99 Diseases of musculoskeletal system and connective tissue | 65+ | Age Specific Rate | 89.9 |
| Females | M00 - M99 Diseases of musculoskeletal system and connective tissue | 0-14 | Age Specific Rate | 3.2 |
| Females | M00 - M99 Diseases of musculoskeletal system and connective tissue | 15-29 | Age Specific Rate | 9.5 |
| Females | M00 - M99 Diseases of musculoskeletal system and connective tissue | 30-44 | Age Specific Rate | 17.1 |
| Females | M00 - M99 Diseases of musculoskeletal system and connective tissue | 45-64 | Age Specific Rate | 43.4 |
| Females | M00 - M99 Diseases of musculoskeletal system and connective tissue | 65+ | Age Specific Rate | 101.6 |
| Persons | M00 - M99 Diseases of musculoskeletal system and connective tissue | Total | Age Standardised Rate | 29.5 |
| Males | M00 - M99 Diseases of musculoskeletal system and connective tissue | Total | Age Standardised Rate | 29.8 |
| Females | M00 - M99 Diseases of musculoskeletal system and connective tissue | Total | Age Standardised Rate | 29.2 |
| Persons | M00 - M99 Diseases of musculoskeletal system and connective tissue | Total | Crude Rate | 33.0 |
| Males | M00 - M99 Diseases of musculoskeletal system and connective tissue | Total | Crude Rate | 32.3 |
| Females | M00 - M99 Diseases of musculoskeletal system and connective tissue | Total | Crude Rate | 33.7 |
| Persons | N00 - N99 Diseases of the genitourinary system | 0-14 | Age Specific Rate | 4.6 |
| Persons | N00 - N99 Diseases of the genitourinary system | 15-29 | Age Specific Rate | 17.9 |
| Persons | N00 - N99 Diseases of the genitourinary system | 30-44 | Age Specific Rate | 27.5 |
| Persons | N00 - N99 Diseases of the genitourinary system | 45-64 | Age Specific Rate | 29.2 |
| Persons | N00 - N99 Diseases of the genitourinary system | 65+ | Age Specific Rate | 49.0 |
| Males | N00 - N99 Diseases of the genitourinary system | 0-14 | Age Specific Rate | 5.3 |
| Males | N00 - N99 Diseases of the genitourinary system | 15-29 | Age Specific Rate | 6.1 |
| Males | N00 - N99 Diseases of the genitourinary system | 30-44 | Age Specific Rate | 9.6 |
| Males | N00 - N99 Diseases of the genitourinary system | 45-64 | Age Specific Rate | 21.4 |
| Males | N00 - N99 Diseases of the genitourinary system | 65+ | Age Specific Rate | 56.8 |
| Females | N00 - N99 Diseases of the genitourinary system | 0-14 | Age Specific Rate | 3.8 |
| Females | N00 - N99 Diseases of the genitourinary system | 15-29 | Age Specific Rate | 29.9 |
| Females | N00 - N99 Diseases of the genitourinary system | 30-44 | Age Specific Rate | 44.6 |
| Females | N00 - N99 Diseases of the genitourinary system | 45-64 | Age Specific Rate | 36.6 |
| Females | N00 - N99 Diseases of the genitourinary system | 65+ | Age Specific Rate | 42.0 |
| Persons | N00 - N99 Diseases of the genitourinary system | Total | Age Standardised Rate | 23.9 |
| Males | N00 - N99 Diseases of the genitourinary system | Total | Age Standardised Rate | 16.7 |
| Females | N00 - N99 Diseases of the genitourinary system | Total | Age Standardised Rate | 31.1 |
| Persons | N00 - N99 Diseases of the genitourinary system | Total | Crude Rate | 25.0 |
| Males | N00 - N99 Diseases of the genitourinary system | Total | Crude Rate | 18.2 |
| Females | N00 - N99 Diseases of the genitourinary system | Total | Crude Rate | 31.7 |
| Persons | O00 - O99 Pregnancy, childbirth and puerperium | 0-14 | Age Specific Rate | 0.0 |
| Persons | O00 - O99 Pregnancy, childbirth and puerperium | 15-29 | Age Specific Rate | 72.6 |
| Persons | O00 - O99 Pregnancy, childbirth and puerperium | 30-44 | Age Specific Rate | 74.2 |
| Persons | O00 - O99 Pregnancy, childbirth and puerperium | 45-64 | Age Specific Rate | 0.3 |
| Persons | O00 - O99 Pregnancy, childbirth and puerperium | 65+ | Age Specific Rate | 0.0 |
| Males | O00 - O99 Pregnancy, childbirth and puerperium | 0-14 | Age Specific Rate | 0.0 |
| Males | O00 - O99 Pregnancy, childbirth and puerperium | 15-29 | Age Specific Rate | 0.0 |
| Males | O00 - O99 Pregnancy, childbirth and puerperium | 30-44 | Age Specific Rate | 0.0 |
| Males | O00 - O99 Pregnancy, childbirth and puerperium | 45-64 | Age Specific Rate | 0.0 |
| Males | O00 - O99 Pregnancy, childbirth and puerperium | 65+ | Age Specific Rate | 0.0 |
| Females | O00 - O99 Pregnancy, childbirth and puerperium | 0-14 | Age Specific Rate | 0.1 |
| Females | O00 - O99 Pregnancy, childbirth and puerperium | 15-29 | Age Specific Rate | 146.4 |
| Females | O00 - O99 Pregnancy, childbirth and puerperium | 30-44 | Age Specific Rate | 145.1 |
| Females | O00 - O99 Pregnancy, childbirth and puerperium | 45-64 | Age Specific Rate | 0.5 |
| Females | O00 - O99 Pregnancy, childbirth and puerperium | 65+ | Age Specific Rate | 0.0 |
| Persons | O00 - O99 Pregnancy, childbirth and puerperium | Total | Age Standardised Rate | 31.3 |
| Males | O00 - O99 Pregnancy, childbirth and puerperium | Total | Age Standardised Rate | NA |
| Females | O00 - O99 Pregnancy, childbirth and puerperium | Total | Age Standardised Rate | 62.0 |
| Persons | O00 - O99 Pregnancy, childbirth and puerperium | Total | Crude Rate | 29.4 |
| Males | O00 - O99 Pregnancy, childbirth and puerperium | Total | Crude Rate | 0.0 |
| Females | O00 - O99 Pregnancy, childbirth and puerperium | Total | Crude Rate | 58.2 |
| Persons | P00 - P96 Conditions originating in perinatal period | 0-14 | Age Specific Rate | 15.9 |
| Persons | P00 - P96 Conditions originating in perinatal period | 15-29 | Age Specific Rate | 0.0 |
| Persons | P00 - P96 Conditions originating in perinatal period | 30-44 | Age Specific Rate | 0.0 |
| Persons | P00 - P96 Conditions originating in perinatal period | 45-64 | Age Specific Rate | 0.0 |
| Persons | P00 - P96 Conditions originating in perinatal period | 65+ | Age Specific Rate | 0.0 |
| Males | P00 - P96 Conditions originating in perinatal period | 0-14 | Age Specific Rate | 17.4 |
| Males | P00 - P96 Conditions originating in perinatal period | 15-29 | Age Specific Rate | 0.0 |
| Males | P00 - P96 Conditions originating in perinatal period | 30-44 | Age Specific Rate | 0.0 |
| Males | P00 - P96 Conditions originating in perinatal period | 45-64 | Age Specific Rate | 0.0 |
| Males | P00 - P96 Conditions originating in perinatal period | 65+ | Age Specific Rate | 0.0 |
| Females | P00 - P96 Conditions originating in perinatal period | 0-14 | Age Specific Rate | 14.4 |
| Females | P00 - P96 Conditions originating in perinatal period | 15-29 | Age Specific Rate | 0.0 |
| Females | P00 - P96 Conditions originating in perinatal period | 30-44 | Age Specific Rate | 0.0 |
| Females | P00 - P96 Conditions originating in perinatal period | 45-64 | Age Specific Rate | 0.0 |
| Females | P00 - P96 Conditions originating in perinatal period | 65+ | Age Specific Rate | 0.0 |
| Persons | P00 - P96 Conditions originating in perinatal period | Total | Age Standardised Rate | 3.3 |
| Males | P00 - P96 Conditions originating in perinatal period | Total | Age Standardised Rate | 3.6 |
| Females | P00 - P96 Conditions originating in perinatal period | Total | Age Standardised Rate | 3.0 |
| Persons | P00 - P96 Conditions originating in perinatal period | Total | Crude Rate | 3.1 |
| Males | P00 - P96 Conditions originating in perinatal period | Total | Crude Rate | 3.5 |
| Females | P00 - P96 Conditions originating in perinatal period | Total | Crude Rate | 2.7 |
| Persons | Q00 - Q99 Congenital anomalies | 0-14 | Age Specific Rate | 5.3 |
| Persons | Q00 - Q99 Congenital anomalies | 15-29 | Age Specific Rate | 1.2 |
| Persons | Q00 - Q99 Congenital anomalies | 30-44 | Age Specific Rate | 0.8 |
| Persons | Q00 - Q99 Congenital anomalies | 45-64 | Age Specific Rate | 0.8 |
| Persons | Q00 - Q99 Congenital anomalies | 65+ | Age Specific Rate | 0.6 |
| Males | Q00 - Q99 Congenital anomalies | 0-14 | Age Specific Rate | 6.7 |
| Males | Q00 - Q99 Congenital anomalies | 15-29 | Age Specific Rate | 0.9 |
| Males | Q00 - Q99 Congenital anomalies | 30-44 | Age Specific Rate | 0.6 |
| Males | Q00 - Q99 Congenital anomalies | 45-64 | Age Specific Rate | 0.8 |
| Males | Q00 - Q99 Congenital anomalies | 65+ | Age Specific Rate | 0.6 |
| Females | Q00 - Q99 Congenital anomalies | 0-14 | Age Specific Rate | 3.8 |
| Females | Q00 - Q99 Congenital anomalies | 15-29 | Age Specific Rate | 1.5 |
| Females | Q00 - Q99 Congenital anomalies | 30-44 | Age Specific Rate | 1.0 |
| Females | Q00 - Q99 Congenital anomalies | 45-64 | Age Specific Rate | 0.8 |
| Females | Q00 - Q99 Congenital anomalies | 65+ | Age Specific Rate | 0.6 |
| Persons | Q00 - Q99 Congenital anomalies | Total | Age Standardised Rate | 1.8 |
| Males | Q00 - Q99 Congenital anomalies | Total | Age Standardised Rate | 2.0 |
| Females | Q00 - Q99 Congenital anomalies | Total | Age Standardised Rate | 1.6 |
| Persons | Q00 - Q99 Congenital anomalies | Total | Crude Rate | 1.7 |
| Males | Q00 - Q99 Congenital anomalies | Total | Crude Rate | 1.9 |
| Females | Q00 - Q99 Congenital anomalies | Total | Crude Rate | 1.5 |
| Persons | R00 - R99 Symptoms, signs and abnormal findings | 0-14 | Age Specific Rate | 14.8 |
| Persons | R00 - R99 Symptoms, signs and abnormal findings | 15-29 | Age Specific Rate | 28.0 |
| Persons | R00 - R99 Symptoms, signs and abnormal findings | 30-44 | Age Specific Rate | 34.8 |
| Persons | R00 - R99 Symptoms, signs and abnormal findings | 45-64 | Age Specific Rate | 59.9 |
| Persons | R00 - R99 Symptoms, signs and abnormal findings | 65+ | Age Specific Rate | 113.2 |
| Males | R00 - R99 Symptoms, signs and abnormal findings | 0-14 | Age Specific Rate | 14.9 |
| Males | R00 - R99 Symptoms, signs and abnormal findings | 15-29 | Age Specific Rate | 16.4 |
| Males | R00 - R99 Symptoms, signs and abnormal findings | 30-44 | Age Specific Rate | 27.0 |
| Males | R00 - R99 Symptoms, signs and abnormal findings | 45-64 | Age Specific Rate | 56.5 |
| Males | R00 - R99 Symptoms, signs and abnormal findings | 65+ | Age Specific Rate | 119.0 |
| Females | R00 - R99 Symptoms, signs and abnormal findings | 0-14 | Age Specific Rate | 14.7 |
| Females | R00 - R99 Symptoms, signs and abnormal findings | 15-29 | Age Specific Rate | 39.8 |
| Females | R00 - R99 Symptoms, signs and abnormal findings | 30-44 | Age Specific Rate | 42.2 |
| Females | R00 - R99 Symptoms, signs and abnormal findings | 45-64 | Age Specific Rate | 63.1 |
| Females | R00 - R99 Symptoms, signs and abnormal findings | 65+ | Age Specific Rate | 108.1 |
| Persons | R00 - R99 Symptoms, signs and abnormal findings | Total | Age Standardised Rate | 44.9 |
| Males | R00 - R99 Symptoms, signs and abnormal findings | Total | Age Standardised Rate | 40.8 |
| Females | R00 - R99 Symptoms, signs and abnormal findings | Total | Age Standardised Rate | 49.0 |
| Persons | R00 - R99 Symptoms, signs and abnormal findings | Total | Crude Rate | 48.4 |
| Males | R00 - R99 Symptoms, signs and abnormal findings | Total | Crude Rate | 43.8 |
| Females | R00 - R99 Symptoms, signs and abnormal findings | Total | Crude Rate | 52.8 |
| Persons | S00 - T98 Injury poisoning and other external causes | 0-14 | Age Specific Rate | 23.4 |
| Persons | S00 - T98 Injury poisoning and other external causes | 15-29 | Age Specific Rate | 35.3 |
| Persons | S00 - T98 Injury poisoning and other external causes | 30-44 | Age Specific Rate | 29.3 |
| Persons | S00 - T98 Injury poisoning and other external causes | 45-64 | Age Specific Rate | 34.0 |
| Persons | S00 - T98 Injury poisoning and other external causes | 65+ | Age Specific Rate | 85.6 |
| Males | S00 - T98 Injury poisoning and other external causes | 0-14 | Age Specific Rate | 27.2 |
| Males | S00 - T98 Injury poisoning and other external causes | 15-29 | Age Specific Rate | 41.8 |
| Males | S00 - T98 Injury poisoning and other external causes | 30-44 | Age Specific Rate | 34.9 |
| Males | S00 - T98 Injury poisoning and other external causes | 45-64 | Age Specific Rate | 37.0 |
| Males | S00 - T98 Injury poisoning and other external causes | 65+ | Age Specific Rate | 80.1 |
| Females | S00 - T98 Injury poisoning and other external causes | 0-14 | Age Specific Rate | 19.4 |
| Females | S00 - T98 Injury poisoning and other external causes | 15-29 | Age Specific Rate | 28.7 |
| Females | S00 - T98 Injury poisoning and other external causes | 30-44 | Age Specific Rate | 23.9 |
| Females | S00 - T98 Injury poisoning and other external causes | 45-64 | Age Specific Rate | 31.1 |
| Females | S00 - T98 Injury poisoning and other external causes | 65+ | Age Specific Rate | 90.7 |
| Persons | S00 - T98 Injury poisoning and other external causes | Total | Age Standardised Rate | 37.6 |
| Males | S00 - T98 Injury poisoning and other external causes | Total | Age Standardised Rate | 41.4 |
| Females | S00 - T98 Injury poisoning and other external causes | Total | Age Standardised Rate | 33.7 |
| Persons | S00 - T98 Injury poisoning and other external causes | Total | Crude Rate | 39.6 |
| Males | S00 - T98 Injury poisoning and other external causes | Total | Crude Rate | 42.2 |
| Females | S00 - T98 Injury poisoning and other external causes | Total | Crude Rate | 36.9 |
| Persons | Z00 - Z99 Factors influencing health status and contact with health services | 0-14 | Age Specific Rate | 14.0 |
| Persons | Z00 - Z99 Factors influencing health status and contact with health services | 15-29 | Age Specific Rate | 25.3 |
| Persons | Z00 - Z99 Factors influencing health status and contact with health services | 30-44 | Age Specific Rate | 69.0 |
| Persons | Z00 - Z99 Factors influencing health status and contact with health services | 45-64 | Age Specific Rate | 177.9 |
| Persons | Z00 - Z99 Factors influencing health status and contact with health services | 65+ | Age Specific Rate | 408.5 |
| Males | Z00 - Z99 Factors influencing health status and contact with health services | 0-14 | Age Specific Rate | 14.7 |
| Males | Z00 - Z99 Factors influencing health status and contact with health services | 15-29 | Age Specific Rate | 18.2 |
| Males | Z00 - Z99 Factors influencing health status and contact with health services | 30-44 | Age Specific Rate | 46.8 |
| Males | Z00 - Z99 Factors influencing health status and contact with health services | 45-64 | Age Specific Rate | 184.4 |
| Males | Z00 - Z99 Factors influencing health status and contact with health services | 65+ | Age Specific Rate | 511.0 |
| Females | Z00 - Z99 Factors influencing health status and contact with health services | 0-14 | Age Specific Rate | 13.2 |
| Females | Z00 - Z99 Factors influencing health status and contact with health services | 15-29 | Age Specific Rate | 32.5 |
| Females | Z00 - Z99 Factors influencing health status and contact with health services | 30-44 | Age Specific Rate | 90.3 |
| Females | Z00 - Z99 Factors influencing health status and contact with health services | 45-64 | Age Specific Rate | 171.7 |
| Females | Z00 - Z99 Factors influencing health status and contact with health services | 65+ | Age Specific Rate | 315.7 |
| Persons | Z00 - Z99 Factors influencing health status and contact with health services | Total | Age Standardised Rate | 115.4 |
| Males | Z00 - Z99 Factors influencing health status and contact with health services | Total | Age Standardised Rate | 123.4 |
| Females | Z00 - Z99 Factors influencing health status and contact with health services | Total | Age Standardised Rate | 108.7 |
| Persons | Z00 - Z99 Factors influencing health status and contact with health services | Total | Crude Rate | 131.1 |
| Males | Z00 - Z99 Factors influencing health status and contact with health services | Total | Crude Rate | 139.8 |
| Females | Z00 - Z99 Factors influencing health status and contact with health services | Total | Crude Rate | 122.6 |
Trends
Trends in admitted episodes of care are presented below, however, changes in hospital admission practices and diagnoses coding rules over time mean that results should be viewed with caution.3–7
Changes in standardised rates for admitted episodes of care include:
- Factors influencing health status and contact with health services increased by 44.0% from 2002–03 to 2020–21, with standardised rates increasing from 80.1 to 115.4 per 1,000 persons.
- Similarly, Symptoms, signs and abnormal findings increased more than two-fold from 19.9 to 44.9 per 1,000 persons.
- Mental and behavioural disorders increased steadily from 2007–08 across all age groups except children.
- Diseases of respiratory system decreased between 2018–2019 and 2020–21. Changes in hospital admission practice during the COVID-19 pandemic and lower numbers of influenza and other respiratory infections were key factors.
Remoteness and socioeconomic differences
Differences in standardised hospitalisation rates between geographic areas are complex and are impacted by multiple factors such as:
- differences in underlying patterns of disease and injury
- the number of hospitalisations needed to treat health conditions
- the availability and accessibility of healthcare locally.
Results should be interpreted as broad patterns that may indicate a need for further analysis. Such analysis, such as adjusting for repeated admissions for a single person, would provide more specific insights for specific conditions.
In 2020–21, people living in remote and very remote areas of Queensland had higher hospitalisation rates. Standardised rates in remote and very remote areas were 620.1 per 1,000 persons in 2020–21 but ranged from 493.3 to 516.2 in major cities and regional areas (Figure 4).
Differences in standardised rates for specific ICD chapters include:
- Factors influencing health status and contact with health services—199.1 per 1,000 persons in remote and very remote areas compared to 111.4 per 1,000 persons in major cities
- Injury poisoning and other external causes—58.7 per 1,000 persons in remote and very remote areas compared to 36.1 per 1,000 persons in major cities.
Conversely, the rate for Mental and behavioural disorders was nearly twice as high in the major cities area compared to remote and very remote areas. Under the ICD coding system, Mental and behavioural disorders includes dementia and Alzheimer’s disease which should be considered in interpreting these results.
Similar patterns were seen between areas with different socioeconomic profiles. Queenslanders living in the most disadvantage areas had the highest standardised hospitalisation rates for Factors influencing health status and contact with health services and Injury poisoning and other external causes while rates for Mental and behavioural disorders were highest among those people living in the most advantaged areas (Figure 4).
Figure 4: All cause hospitalisation rates by remoteness and socioeconomic status, 2020–21


| Area classification | Area category | Condition | Type | Rate per 1,000 |
|---|---|---|---|---|
| SEIFA | Most disadvantaged | A00 - B99 Infectious and parasitic diseases | Crude Rate | 10.6 |
| SEIFA | Most disadvantaged | A00 - B99 Infectious and parasitic diseases | Age Standardised Rate | 9.5 |
| SEIFA | Q2 | A00 - B99 Infectious and parasitic diseases | Crude Rate | 9.8 |
| SEIFA | Q2 | A00 - B99 Infectious and parasitic diseases | Age Standardised Rate | 8.8 |
| SEIFA | Q3 | A00 - B99 Infectious and parasitic diseases | Crude Rate | 7.6 |
| SEIFA | Q3 | A00 - B99 Infectious and parasitic diseases | Age Standardised Rate | 7.3 |
| SEIFA | Q4 | A00 - B99 Infectious and parasitic diseases | Crude Rate | 7.1 |
| SEIFA | Q4 | A00 - B99 Infectious and parasitic diseases | Age Standardised Rate | 6.9 |
| SEIFA | Most advantaged | A00 - B99 Infectious and parasitic diseases | Crude Rate | 6.0 |
| SEIFA | Most advantaged | A00 - B99 Infectious and parasitic diseases | Age Standardised Rate | 6.0 |
| SEIFA | Most disadvantaged | All cause (A00-Z99) | Crude Rate | 638.4 |
| SEIFA | Most disadvantaged | All cause (A00-Z99) | Age Standardised Rate | 564.2 |
| SEIFA | Q2 | All cause (A00-Z99) | Crude Rate | 590.3 |
| SEIFA | Q2 | All cause (A00-Z99) | Age Standardised Rate | 517.1 |
| SEIFA | Q3 | All cause (A00-Z99) | Crude Rate | 532.4 |
| SEIFA | Q3 | All cause (A00-Z99) | Age Standardised Rate | 499.2 |
| SEIFA | Q4 | All cause (A00-Z99) | Crude Rate | 522.3 |
| SEIFA | Q4 | All cause (A00-Z99) | Age Standardised Rate | 495.9 |
| SEIFA | Most advantaged | All cause (A00-Z99) | Crude Rate | 485.8 |
| SEIFA | Most advantaged | All cause (A00-Z99) | Age Standardised Rate | 473.7 |
| SEIFA | Most disadvantaged | C00 - C97 Malignant neoplasms | Crude Rate | 22.4 |
| SEIFA | Most disadvantaged | C00 - C97 Malignant neoplasms | Age Standardised Rate | 16.9 |
| SEIFA | Q2 | C00 - C97 Malignant neoplasms | Crude Rate | 22.2 |
| SEIFA | Q2 | C00 - C97 Malignant neoplasms | Age Standardised Rate | 16.9 |
| SEIFA | Q3 | C00 - C97 Malignant neoplasms | Crude Rate | 19.6 |
| SEIFA | Q3 | C00 - C97 Malignant neoplasms | Age Standardised Rate | 17.1 |
| SEIFA | Q4 | C00 - C97 Malignant neoplasms | Crude Rate | 19.3 |
| SEIFA | Q4 | C00 - C97 Malignant neoplasms | Age Standardised Rate | 17.4 |
| SEIFA | Most advantaged | C00 - C97 Malignant neoplasms | Crude Rate | 20.1 |
| SEIFA | Most advantaged | C00 - C97 Malignant neoplasms | Age Standardised Rate | 19.4 |
| SEIFA | Most disadvantaged | D00 - D48 Benign and other neoplasms | Crude Rate | 14.1 |
| SEIFA | Most disadvantaged | D00 - D48 Benign and other neoplasms | Age Standardised Rate | 11.4 |
| SEIFA | Q2 | D00 - D48 Benign and other neoplasms | Crude Rate | 14.2 |
| SEIFA | Q2 | D00 - D48 Benign and other neoplasms | Age Standardised Rate | 11.6 |
| SEIFA | Q3 | D00 - D48 Benign and other neoplasms | Crude Rate | 13.9 |
| SEIFA | Q3 | D00 - D48 Benign and other neoplasms | Age Standardised Rate | 12.6 |
| SEIFA | Q4 | D00 - D48 Benign and other neoplasms | Crude Rate | 14.4 |
| SEIFA | Q4 | D00 - D48 Benign and other neoplasms | Age Standardised Rate | 13.4 |
| SEIFA | Most advantaged | D00 - D48 Benign and other neoplasms | Crude Rate | 16.8 |
| SEIFA | Most advantaged | D00 - D48 Benign and other neoplasms | Age Standardised Rate | 16.2 |
| SEIFA | Most disadvantaged | D50 - D89 Diseases of blood and blood forming organs etc | Crude Rate | 11.2 |
| SEIFA | Most disadvantaged | D50 - D89 Diseases of blood and blood forming organs etc | Age Standardised Rate | 9.2 |
| SEIFA | Q2 | D50 - D89 Diseases of blood and blood forming organs etc | Crude Rate | 11.8 |
| SEIFA | Q2 | D50 - D89 Diseases of blood and blood forming organs etc | Age Standardised Rate | 9.6 |
| SEIFA | Q3 | D50 - D89 Diseases of blood and blood forming organs etc | Crude Rate | 10.1 |
| SEIFA | Q3 | D50 - D89 Diseases of blood and blood forming organs etc | Age Standardised Rate | 9.1 |
| SEIFA | Q4 | D50 - D89 Diseases of blood and blood forming organs etc | Crude Rate | 10.8 |
| SEIFA | Q4 | D50 - D89 Diseases of blood and blood forming organs etc | Age Standardised Rate | 10.1 |
| SEIFA | Most advantaged | D50 - D89 Diseases of blood and blood forming organs etc | Crude Rate | 10.4 |
| SEIFA | Most advantaged | D50 - D89 Diseases of blood and blood forming organs etc | Age Standardised Rate | 10.1 |
| SEIFA | Most disadvantaged | E00 - E89/E90 Endocrine, nutritional and metabolic disorders including diabetes | Crude Rate | 12.6 |
| SEIFA | Most disadvantaged | E00 - E89/E90 Endocrine, nutritional and metabolic disorders including diabetes | Age Standardised Rate | 11.7 |
| SEIFA | Q2 | E00 - E89/E90 Endocrine, nutritional and metabolic disorders including diabetes | Crude Rate | 11.1 |
| SEIFA | Q2 | E00 - E89/E90 Endocrine, nutritional and metabolic disorders including diabetes | Age Standardised Rate | 10.1 |
| SEIFA | Q3 | E00 - E89/E90 Endocrine, nutritional and metabolic disorders including diabetes | Crude Rate | 10.3 |
| SEIFA | Q3 | E00 - E89/E90 Endocrine, nutritional and metabolic disorders including diabetes | Age Standardised Rate | 9.9 |
| SEIFA | Q4 | E00 - E89/E90 Endocrine, nutritional and metabolic disorders including diabetes | Crude Rate | 9.7 |
| SEIFA | Q4 | E00 - E89/E90 Endocrine, nutritional and metabolic disorders including diabetes | Age Standardised Rate | 9.4 |
| SEIFA | Most advantaged | E00 - E89/E90 Endocrine, nutritional and metabolic disorders including diabetes | Crude Rate | 8.4 |
| SEIFA | Most advantaged | E00 - E89/E90 Endocrine, nutritional and metabolic disorders including diabetes | Age Standardised Rate | 8.2 |
| SEIFA | Most disadvantaged | F00 - F99 Mental and behavioural disorders | Crude Rate | 22.2 |
| SEIFA | Most disadvantaged | F00 - F99 Mental and behavioural disorders | Age Standardised Rate | 22.9 |
| SEIFA | Q2 | F00 - F99 Mental and behavioural disorders | Crude Rate | 22.0 |
| SEIFA | Q2 | F00 - F99 Mental and behavioural disorders | Age Standardised Rate | 21.8 |
| SEIFA | Q3 | F00 - F99 Mental and behavioural disorders | Crude Rate | 24.5 |
| SEIFA | Q3 | F00 - F99 Mental and behavioural disorders | Age Standardised Rate | 24.3 |
| SEIFA | Q4 | F00 - F99 Mental and behavioural disorders | Crude Rate | 29.8 |
| SEIFA | Q4 | F00 - F99 Mental and behavioural disorders | Age Standardised Rate | 29.5 |
| SEIFA | Most advantaged | F00 - F99 Mental and behavioural disorders | Crude Rate | 37.2 |
| SEIFA | Most advantaged | F00 - F99 Mental and behavioural disorders | Age Standardised Rate | 36.0 |
| SEIFA | Most disadvantaged | G00 - G99 Nervous system and sense organ disorders | Crude Rate | 17.1 |
| SEIFA | Most disadvantaged | G00 - G99 Nervous system and sense organ disorders | Age Standardised Rate | 15.5 |
| SEIFA | Q2 | G00 - G99 Nervous system and sense organ disorders | Crude Rate | 17.1 |
| SEIFA | Q2 | G00 - G99 Nervous system and sense organ disorders | Age Standardised Rate | 15.3 |
| SEIFA | Q3 | G00 - G99 Nervous system and sense organ disorders | Crude Rate | 15.7 |
| SEIFA | Q3 | G00 - G99 Nervous system and sense organ disorders | Age Standardised Rate | 14.8 |
| SEIFA | Q4 | G00 - G99 Nervous system and sense organ disorders | Crude Rate | 16.1 |
| SEIFA | Q4 | G00 - G99 Nervous system and sense organ disorders | Age Standardised Rate | 15.3 |
| SEIFA | Most advantaged | G00 - G99 Nervous system and sense organ disorders | Crude Rate | 17.3 |
| SEIFA | Most advantaged | G00 - G99 Nervous system and sense organ disorders | Age Standardised Rate | 16.9 |
| SEIFA | Most disadvantaged | H00 - H59 Diseases of eye and adnexa | Crude Rate | 25.0 |
| SEIFA | Most disadvantaged | H00 - H59 Diseases of eye and adnexa | Age Standardised Rate | 18.1 |
| SEIFA | Q2 | H00 - H59 Diseases of eye and adnexa | Crude Rate | 24.4 |
| SEIFA | Q2 | H00 - H59 Diseases of eye and adnexa | Age Standardised Rate | 17.8 |
| SEIFA | Q3 | H00 - H59 Diseases of eye and adnexa | Crude Rate | 21.9 |
| SEIFA | Q3 | H00 - H59 Diseases of eye and adnexa | Age Standardised Rate | 18.9 |
| SEIFA | Q4 | H00 - H59 Diseases of eye and adnexa | Crude Rate | 20.9 |
| SEIFA | Q4 | H00 - H59 Diseases of eye and adnexa | Age Standardised Rate | 18.7 |
| SEIFA | Most advantaged | H00 - H59 Diseases of eye and adnexa | Crude Rate | 19.9 |
| SEIFA | Most advantaged | H00 - H59 Diseases of eye and adnexa | Age Standardised Rate | 19.2 |
| SEIFA | Most disadvantaged | H60 - H95 Diseases of ear and mastoid process | Crude Rate | 4.0 |
| SEIFA | Most disadvantaged | H60 - H95 Diseases of ear and mastoid process | Age Standardised Rate | 3.7 |
| SEIFA | Q2 | H60 - H95 Diseases of ear and mastoid process | Crude Rate | 3.4 |
| SEIFA | Q2 | H60 - H95 Diseases of ear and mastoid process | Age Standardised Rate | 3.1 |
| SEIFA | Q3 | H60 - H95 Diseases of ear and mastoid process | Crude Rate | 3.6 |
| SEIFA | Q3 | H60 - H95 Diseases of ear and mastoid process | Age Standardised Rate | 3.5 |
| SEIFA | Q4 | H60 - H95 Diseases of ear and mastoid process | Crude Rate | 3.5 |
| SEIFA | Q4 | H60 - H95 Diseases of ear and mastoid process | Age Standardised Rate | 3.4 |
| SEIFA | Most advantaged | H60 - H95 Diseases of ear and mastoid process | Crude Rate | 3.0 |
| SEIFA | Most advantaged | H60 - H95 Diseases of ear and mastoid process | Age Standardised Rate | 3.1 |
| SEIFA | Most disadvantaged | I00 - I99 Diseases of circulatory system | Crude Rate | 33.8 |
| SEIFA | Most disadvantaged | I00 - I99 Diseases of circulatory system | Age Standardised Rate | 26.1 |
| SEIFA | Q2 | I00 - I99 Diseases of circulatory system | Crude Rate | 30.6 |
| SEIFA | Q2 | I00 - I99 Diseases of circulatory system | Age Standardised Rate | 23.5 |
| SEIFA | Q3 | I00 - I99 Diseases of circulatory system | Crude Rate | 25.1 |
| SEIFA | Q3 | I00 - I99 Diseases of circulatory system | Age Standardised Rate | 22.1 |
| SEIFA | Q4 | I00 - I99 Diseases of circulatory system | Crude Rate | 23.6 |
| SEIFA | Q4 | I00 - I99 Diseases of circulatory system | Age Standardised Rate | 21.3 |
| SEIFA | Most advantaged | I00 - I99 Diseases of circulatory system | Crude Rate | 20.8 |
| SEIFA | Most advantaged | I00 - I99 Diseases of circulatory system | Age Standardised Rate | 20.0 |
| SEIFA | Most disadvantaged | J00 - J99 Diseases of respiratory system | Crude Rate | 24.3 |
| SEIFA | Most disadvantaged | J00 - J99 Diseases of respiratory system | Age Standardised Rate | 21.5 |
| SEIFA | Q2 | J00 - J99 Diseases of respiratory system | Crude Rate | 21.1 |
| SEIFA | Q2 | J00 - J99 Diseases of respiratory system | Age Standardised Rate | 19.1 |
| SEIFA | Q3 | J00 - J99 Diseases of respiratory system | Crude Rate | 18.3 |
| SEIFA | Q3 | J00 - J99 Diseases of respiratory system | Age Standardised Rate | 17.6 |
| SEIFA | Q4 | J00 - J99 Diseases of respiratory system | Crude Rate | 17.6 |
| SEIFA | Q4 | J00 - J99 Diseases of respiratory system | Age Standardised Rate | 17.2 |
| SEIFA | Most advantaged | J00 - J99 Diseases of respiratory system | Crude Rate | 14.1 |
| SEIFA | Most advantaged | J00 - J99 Diseases of respiratory system | Age Standardised Rate | 14.5 |
| SEIFA | Most disadvantaged | K00 - K93 Diseases of the digestive system | Crude Rate | 52.9 |
| SEIFA | Most disadvantaged | K00 - K93 Diseases of the digestive system | Age Standardised Rate | 48.9 |
| SEIFA | Q2 | K00 - K93 Diseases of the digestive system | Crude Rate | 53.6 |
| SEIFA | Q2 | K00 - K93 Diseases of the digestive system | Age Standardised Rate | 49.0 |
| SEIFA | Q3 | K00 - K93 Diseases of the digestive system | Crude Rate | 52.4 |
| SEIFA | Q3 | K00 - K93 Diseases of the digestive system | Age Standardised Rate | 50.0 |
| SEIFA | Q4 | K00 - K93 Diseases of the digestive system | Crude Rate | 51.1 |
| SEIFA | Q4 | K00 - K93 Diseases of the digestive system | Age Standardised Rate | 49.3 |
| SEIFA | Most advantaged | K00 - K93 Diseases of the digestive system | Crude Rate | 49.4 |
| SEIFA | Most advantaged | K00 - K93 Diseases of the digestive system | Age Standardised Rate | 48.1 |
| SEIFA | Most disadvantaged | L00 - L99 Diseases of skin and subcutaneous tissue | Crude Rate | 12.4 |
| SEIFA | Most disadvantaged | L00 - L99 Diseases of skin and subcutaneous tissue | Age Standardised Rate | 11.8 |
| SEIFA | Q2 | L00 - L99 Diseases of skin and subcutaneous tissue | Crude Rate | 10.3 |
| SEIFA | Q2 | L00 - L99 Diseases of skin and subcutaneous tissue | Age Standardised Rate | 9.5 |
| SEIFA | Q3 | L00 - L99 Diseases of skin and subcutaneous tissue | Crude Rate | 8.0 |
| SEIFA | Q3 | L00 - L99 Diseases of skin and subcutaneous tissue | Age Standardised Rate | 7.7 |
| SEIFA | Q4 | L00 - L99 Diseases of skin and subcutaneous tissue | Crude Rate | 7.3 |
| SEIFA | Q4 | L00 - L99 Diseases of skin and subcutaneous tissue | Age Standardised Rate | 7.1 |
| SEIFA | Most advantaged | L00 - L99 Diseases of skin and subcutaneous tissue | Crude Rate | 6.5 |
| SEIFA | Most advantaged | L00 - L99 Diseases of skin and subcutaneous tissue | Age Standardised Rate | 6.4 |
| SEIFA | Most disadvantaged | M00 - M99 Diseases of musculoskeletal system and connective tissue | Crude Rate | 33.2 |
| SEIFA | Most disadvantaged | M00 - M99 Diseases of musculoskeletal system and connective tissue | Age Standardised Rate | 28.2 |
| SEIFA | Q2 | M00 - M99 Diseases of musculoskeletal system and connective tissue | Crude Rate | 34.7 |
| SEIFA | Q2 | M00 - M99 Diseases of musculoskeletal system and connective tissue | Age Standardised Rate | 28.7 |
| SEIFA | Q3 | M00 - M99 Diseases of musculoskeletal system and connective tissue | Crude Rate | 33.7 |
| SEIFA | Q3 | M00 - M99 Diseases of musculoskeletal system and connective tissue | Age Standardised Rate | 30.8 |
| SEIFA | Q4 | M00 - M99 Diseases of musculoskeletal system and connective tissue | Crude Rate | 33.5 |
| SEIFA | Q4 | M00 - M99 Diseases of musculoskeletal system and connective tissue | Age Standardised Rate | 31.2 |
| SEIFA | Most advantaged | M00 - M99 Diseases of musculoskeletal system and connective tissue | Crude Rate | 30.2 |
| SEIFA | Most advantaged | M00 - M99 Diseases of musculoskeletal system and connective tissue | Age Standardised Rate | 29.2 |
| SEIFA | Most disadvantaged | N00 - N99 Diseases of the genitourinary system | Crude Rate | 27.8 |
| SEIFA | Most disadvantaged | N00 - N99 Diseases of the genitourinary system | Age Standardised Rate | 26.0 |
| SEIFA | Q2 | N00 - N99 Diseases of the genitourinary system | Crude Rate | 25.9 |
| SEIFA | Q2 | N00 - N99 Diseases of the genitourinary system | Age Standardised Rate | 23.9 |
| SEIFA | Q3 | N00 - N99 Diseases of the genitourinary system | Crude Rate | 24.9 |
| SEIFA | Q3 | N00 - N99 Diseases of the genitourinary system | Age Standardised Rate | 24.2 |
| SEIFA | Q4 | N00 - N99 Diseases of the genitourinary system | Crude Rate | 24.8 |
| SEIFA | Q4 | N00 - N99 Diseases of the genitourinary system | Age Standardised Rate | 24.1 |
| SEIFA | Most advantaged | N00 - N99 Diseases of the genitourinary system | Crude Rate | 22.1 |
| SEIFA | Most advantaged | N00 - N99 Diseases of the genitourinary system | Age Standardised Rate | 21.6 |
| SEIFA | Most disadvantaged | O00 - O99 Pregnancy, childbirth and puerperium | Crude Rate | 31.7 |
| SEIFA | Most disadvantaged | O00 - O99 Pregnancy, childbirth and puerperium | Age Standardised Rate | 36.7 |
| SEIFA | Q2 | O00 - O99 Pregnancy, childbirth and puerperium | Crude Rate | 29.4 |
| SEIFA | Q2 | O00 - O99 Pregnancy, childbirth and puerperium | Age Standardised Rate | 34.2 |
| SEIFA | Q3 | O00 - O99 Pregnancy, childbirth and puerperium | Crude Rate | 32.6 |
| SEIFA | Q3 | O00 - O99 Pregnancy, childbirth and puerperium | Age Standardised Rate | 34.5 |
| SEIFA | Q4 | O00 - O99 Pregnancy, childbirth and puerperium | Crude Rate | 30.5 |
| SEIFA | Q4 | O00 - O99 Pregnancy, childbirth and puerperium | Age Standardised Rate | 31.6 |
| SEIFA | Most advantaged | O00 - O99 Pregnancy, childbirth and puerperium | Crude Rate | 23.3 |
| SEIFA | Most advantaged | O00 - O99 Pregnancy, childbirth and puerperium | Age Standardised Rate | 22.5 |
| SEIFA | Most disadvantaged | P00 - P96 Conditions originating in perinatal period | Crude Rate | 3.6 |
| SEIFA | Most disadvantaged | P00 - P96 Conditions originating in perinatal period | Age Standardised Rate | 3.6 |
| SEIFA | Q2 | P00 - P96 Conditions originating in perinatal period | Crude Rate | 3.3 |
| SEIFA | Q2 | P00 - P96 Conditions originating in perinatal period | Age Standardised Rate | 3.5 |
| SEIFA | Q3 | P00 - P96 Conditions originating in perinatal period | Crude Rate | 3.2 |
| SEIFA | Q3 | P00 - P96 Conditions originating in perinatal period | Age Standardised Rate | 3.3 |
| SEIFA | Q4 | P00 - P96 Conditions originating in perinatal period | Crude Rate | 3.0 |
| SEIFA | Q4 | P00 - P96 Conditions originating in perinatal period | Age Standardised Rate | 3.2 |
| SEIFA | Most advantaged | P00 - P96 Conditions originating in perinatal period | Crude Rate | 2.4 |
| SEIFA | Most advantaged | P00 - P96 Conditions originating in perinatal period | Age Standardised Rate | 3.0 |
| SEIFA | Most disadvantaged | Q00 - Q99 Congenital anomalies | Crude Rate | 1.8 |
| SEIFA | Most disadvantaged | Q00 - Q99 Congenital anomalies | Age Standardised Rate | 1.8 |
| SEIFA | Q2 | Q00 - Q99 Congenital anomalies | Crude Rate | 1.7 |
| SEIFA | Q2 | Q00 - Q99 Congenital anomalies | Age Standardised Rate | 1.8 |
| SEIFA | Q3 | Q00 - Q99 Congenital anomalies | Crude Rate | 1.7 |
| SEIFA | Q3 | Q00 - Q99 Congenital anomalies | Age Standardised Rate | 1.8 |
| SEIFA | Q4 | Q00 - Q99 Congenital anomalies | Crude Rate | 1.8 |
| SEIFA | Q4 | Q00 - Q99 Congenital anomalies | Age Standardised Rate | 1.8 |
| SEIFA | Most advantaged | Q00 - Q99 Congenital anomalies | Crude Rate | 1.6 |
| SEIFA | Most advantaged | Q00 - Q99 Congenital anomalies | Age Standardised Rate | 1.8 |
| SEIFA | Most disadvantaged | R00 - R99 Symptoms, signs and abnormal findings | Crude Rate | 55.5 |
| SEIFA | Most disadvantaged | R00 - R99 Symptoms, signs and abnormal findings | Age Standardised Rate | 50.4 |
| SEIFA | Q2 | R00 - R99 Symptoms, signs and abnormal findings | Crude Rate | 51.8 |
| SEIFA | Q2 | R00 - R99 Symptoms, signs and abnormal findings | Age Standardised Rate | 45.9 |
| SEIFA | Q3 | R00 - R99 Symptoms, signs and abnormal findings | Crude Rate | 48.1 |
| SEIFA | Q3 | R00 - R99 Symptoms, signs and abnormal findings | Age Standardised Rate | 45.3 |
| SEIFA | Q4 | R00 - R99 Symptoms, signs and abnormal findings | Crude Rate | 46.3 |
| SEIFA | Q4 | R00 - R99 Symptoms, signs and abnormal findings | Age Standardised Rate | 44.1 |
| SEIFA | Most advantaged | R00 - R99 Symptoms, signs and abnormal findings | Crude Rate | 40.9 |
| SEIFA | Most advantaged | R00 - R99 Symptoms, signs and abnormal findings | Age Standardised Rate | 39.9 |
| SEIFA | Most disadvantaged | S00 - T98 Injury poisoning and other external causes | Crude Rate | 48.4 |
| SEIFA | Most disadvantaged | S00 - T98 Injury poisoning and other external causes | Age Standardised Rate | 45.4 |
| SEIFA | Q2 | S00 - T98 Injury poisoning and other external causes | Crude Rate | 45.2 |
| SEIFA | Q2 | S00 - T98 Injury poisoning and other external causes | Age Standardised Rate | 42.2 |
| SEIFA | Q3 | S00 - T98 Injury poisoning and other external causes | Crude Rate | 38.0 |
| SEIFA | Q3 | S00 - T98 Injury poisoning and other external causes | Age Standardised Rate | 36.6 |
| SEIFA | Q4 | S00 - T98 Injury poisoning and other external causes | Crude Rate | 35.9 |
| SEIFA | Q4 | S00 - T98 Injury poisoning and other external causes | Age Standardised Rate | 34.7 |
| SEIFA | Most advantaged | S00 - T98 Injury poisoning and other external causes | Crude Rate | 31.3 |
| SEIFA | Most advantaged | S00 - T98 Injury poisoning and other external causes | Age Standardised Rate | 30.9 |
| SEIFA | Most disadvantaged | Z00 - Z99 Factors influencing health status and contact with health services | Crude Rate | 174.0 |
| SEIFA | Most disadvantaged | Z00 - Z99 Factors influencing health status and contact with health services | Age Standardised Rate | 145.0 |
| SEIFA | Q2 | Z00 - Z99 Factors influencing health status and contact with health services | Crude Rate | 146.9 |
| SEIFA | Q2 | Z00 - Z99 Factors influencing health status and contact with health services | Age Standardised Rate | 120.7 |
| SEIFA | Q3 | Z00 - Z99 Factors influencing health status and contact with health services | Crude Rate | 119.4 |
| SEIFA | Q3 | Z00 - Z99 Factors influencing health status and contact with health services | Age Standardised Rate | 107.7 |
| SEIFA | Q4 | Z00 - Z99 Factors influencing health status and contact with health services | Crude Rate | 115.4 |
| SEIFA | Q4 | Z00 - Z99 Factors influencing health status and contact with health services | Age Standardised Rate | 106.2 |
| SEIFA | Most advantaged | Z00 - Z99 Factors influencing health status and contact with health services | Crude Rate | 103.9 |
| SEIFA | Most advantaged | Z00 - Z99 Factors influencing health status and contact with health services | Age Standardised Rate | 100.7 |
| Remoteness | Major cities | A00 - B99 Infectious and parasitic diseases | Crude Rate | 7.6 |
| Remoteness | Major cities | A00 - B99 Infectious and parasitic diseases | Age Standardised Rate | 7.3 |
| Remoteness | Inner regional | A00 - B99 Infectious and parasitic diseases | Crude Rate | 9.4 |
| Remoteness | Inner regional | A00 - B99 Infectious and parasitic diseases | Age Standardised Rate | 8.2 |
| Remoteness | Outer regional | A00 - B99 Infectious and parasitic diseases | Crude Rate | 8.5 |
| Remoteness | Outer regional | A00 - B99 Infectious and parasitic diseases | Age Standardised Rate | 8.0 |
| Remoteness | Remote and very remote | A00 - B99 Infectious and parasitic diseases | Crude Rate | 12.2 |
| Remoteness | Remote and very remote | A00 - B99 Infectious and parasitic diseases | Age Standardised Rate | 12.1 |
| Remoteness | Major cities | All cause (A00-Z99) | Crude Rate | 540.1 |
| Remoteness | Major cities | All cause (A00-Z99) | Age Standardised Rate | 508.0 |
| Remoteness | Inner regional | All cause (A00-Z99) | Crude Rate | 574.5 |
| Remoteness | Inner regional | All cause (A00-Z99) | Age Standardised Rate | 493.3 |
| Remoteness | Outer regional | All cause (A00-Z99) | Crude Rate | 566.4 |
| Remoteness | Outer regional | All cause (A00-Z99) | Age Standardised Rate | 516.2 |
| Remoteness | Remote and very remote | All cause (A00-Z99) | Crude Rate | 617.4 |
| Remoteness | Remote and very remote | All cause (A00-Z99) | Age Standardised Rate | 620.1 |
| Remoteness | Major cities | C00 - C97 Malignant neoplasms | Crude Rate | 20.1 |
| Remoteness | Major cities | C00 - C97 Malignant neoplasms | Age Standardised Rate | 17.9 |
| Remoteness | Inner regional | C00 - C97 Malignant neoplasms | Crude Rate | 23.2 |
| Remoteness | Inner regional | C00 - C97 Malignant neoplasms | Age Standardised Rate | 16.7 |
| Remoteness | Outer regional | C00 - C97 Malignant neoplasms | Crude Rate | 20.4 |
| Remoteness | Outer regional | C00 - C97 Malignant neoplasms | Age Standardised Rate | 16.7 |
| Remoteness | Remote and very remote | C00 - C97 Malignant neoplasms | Crude Rate | 15.8 |
| Remoteness | Remote and very remote | C00 - C97 Malignant neoplasms | Age Standardised Rate | 15.6 |
| Remoteness | Major cities | D00 - D48 Benign and other neoplasms | Crude Rate | 14.8 |
| Remoteness | Major cities | D00 - D48 Benign and other neoplasms | Age Standardised Rate | 13.6 |
| Remoteness | Inner regional | D00 - D48 Benign and other neoplasms | Crude Rate | 16.2 |
| Remoteness | Inner regional | D00 - D48 Benign and other neoplasms | Age Standardised Rate | 12.7 |
| Remoteness | Outer regional | D00 - D48 Benign and other neoplasms | Crude Rate | 13.0 |
| Remoteness | Outer regional | D00 - D48 Benign and other neoplasms | Age Standardised Rate | 11.2 |
| Remoteness | Remote and very remote | D00 - D48 Benign and other neoplasms | Crude Rate | 8.5 |
| Remoteness | Remote and very remote | D00 - D48 Benign and other neoplasms | Age Standardised Rate | 8.3 |
| Remoteness | Major cities | D50 - D89 Diseases of blood and blood forming organs etc | Crude Rate | 11.1 |
| Remoteness | Major cities | D50 - D89 Diseases of blood and blood forming organs etc | Age Standardised Rate | 10.1 |
| Remoteness | Inner regional | D50 - D89 Diseases of blood and blood forming organs etc | Crude Rate | 11.7 |
| Remoteness | Inner regional | D50 - D89 Diseases of blood and blood forming organs etc | Age Standardised Rate | 9.2 |
| Remoteness | Outer regional | D50 - D89 Diseases of blood and blood forming organs etc | Crude Rate | 9.1 |
| Remoteness | Outer regional | D50 - D89 Diseases of blood and blood forming organs etc | Age Standardised Rate | 8.0 |
| Remoteness | Remote and very remote | D50 - D89 Diseases of blood and blood forming organs etc | Crude Rate | 7.3 |
| Remoteness | Remote and very remote | D50 - D89 Diseases of blood and blood forming organs etc | Age Standardised Rate | 7.6 |
| Remoteness | Major cities | E00 - E89/E90 Endocrine, nutritional and metabolic disorders including diabetes | Crude Rate | 10.0 |
| Remoteness | Major cities | E00 - E89/E90 Endocrine, nutritional and metabolic disorders including diabetes | Age Standardised Rate | 9.6 |
| Remoteness | Inner regional | E00 - E89/E90 Endocrine, nutritional and metabolic disorders including diabetes | Crude Rate | 10.9 |
| Remoteness | Inner regional | E00 - E89/E90 Endocrine, nutritional and metabolic disorders including diabetes | Age Standardised Rate | 10.0 |
| Remoteness | Outer regional | E00 - E89/E90 Endocrine, nutritional and metabolic disorders including diabetes | Crude Rate | 10.7 |
| Remoteness | Outer regional | E00 - E89/E90 Endocrine, nutritional and metabolic disorders including diabetes | Age Standardised Rate | 10.0 |
| Remoteness | Remote and very remote | E00 - E89/E90 Endocrine, nutritional and metabolic disorders including diabetes | Crude Rate | 14.7 |
| Remoteness | Remote and very remote | E00 - E89/E90 Endocrine, nutritional and metabolic disorders including diabetes | Age Standardised Rate | 14.9 |
| Remoteness | Major cities | F00 - F99 Mental and behavioural disorders | Crude Rate | 33.0 |
| Remoteness | Major cities | F00 - F99 Mental and behavioural disorders | Age Standardised Rate | 32.3 |
| Remoteness | Inner regional | F00 - F99 Mental and behavioural disorders | Crude Rate | 16.0 |
| Remoteness | Inner regional | F00 - F99 Mental and behavioural disorders | Age Standardised Rate | 16.2 |
| Remoteness | Outer regional | F00 - F99 Mental and behavioural disorders | Crude Rate | 18.7 |
| Remoteness | Outer regional | F00 - F99 Mental and behavioural disorders | Age Standardised Rate | 19.1 |
| Remoteness | Remote and very remote | F00 - F99 Mental and behavioural disorders | Crude Rate | 16.2 |
| Remoteness | Remote and very remote | F00 - F99 Mental and behavioural disorders | Age Standardised Rate | 17.4 |
| Remoteness | Major cities | G00 - G99 Nervous system and sense organ disorders | Crude Rate | 16.7 |
| Remoteness | Major cities | G00 - G99 Nervous system and sense organ disorders | Age Standardised Rate | 15.9 |
| Remoteness | Inner regional | G00 - G99 Nervous system and sense organ disorders | Crude Rate | 17.6 |
| Remoteness | Inner regional | G00 - G99 Nervous system and sense organ disorders | Age Standardised Rate | 15.3 |
| Remoteness | Outer regional | G00 - G99 Nervous system and sense organ disorders | Crude Rate | 15.4 |
| Remoteness | Outer regional | G00 - G99 Nervous system and sense organ disorders | Age Standardised Rate | 14.2 |
| Remoteness | Remote and very remote | G00 - G99 Nervous system and sense organ disorders | Crude Rate | 11.6 |
| Remoteness | Remote and very remote | G00 - G99 Nervous system and sense organ disorders | Age Standardised Rate | 11.7 |
| Remoteness | Major cities | H00 - H59 Diseases of eye and adnexa | Crude Rate | 22.8 |
| Remoteness | Major cities | H00 - H59 Diseases of eye and adnexa | Age Standardised Rate | 20.0 |
| Remoteness | Inner regional | H00 - H59 Diseases of eye and adnexa | Crude Rate | 24.2 |
| Remoteness | Inner regional | H00 - H59 Diseases of eye and adnexa | Age Standardised Rate | 16.6 |
| Remoteness | Outer regional | H00 - H59 Diseases of eye and adnexa | Crude Rate | 19.0 |
| Remoteness | Outer regional | H00 - H59 Diseases of eye and adnexa | Age Standardised Rate | 15.3 |
| Remoteness | Remote and very remote | H00 - H59 Diseases of eye and adnexa | Crude Rate | 14.6 |
| Remoteness | Remote and very remote | H00 - H59 Diseases of eye and adnexa | Age Standardised Rate | 14.3 |
| Remoteness | Major cities | H60 - H95 Diseases of ear and mastoid process | Crude Rate | 3.7 |
| Remoteness | Major cities | H60 - H95 Diseases of ear and mastoid process | Age Standardised Rate | 3.6 |
| Remoteness | Inner regional | H60 - H95 Diseases of ear and mastoid process | Crude Rate | 3.2 |
| Remoteness | Inner regional | H60 - H95 Diseases of ear and mastoid process | Age Standardised Rate | 2.9 |
| Remoteness | Outer regional | H60 - H95 Diseases of ear and mastoid process | Crude Rate | 2.9 |
| Remoteness | Outer regional | H60 - H95 Diseases of ear and mastoid process | Age Standardised Rate | 2.7 |
| Remoteness | Remote and very remote | H60 - H95 Diseases of ear and mastoid process | Crude Rate | 3.7 |
| Remoteness | Remote and very remote | H60 - H95 Diseases of ear and mastoid process | Age Standardised Rate | 3.5 |
| Remoteness | Major cities | I00 - I99 Diseases of circulatory system | Crude Rate | 24.4 |
| Remoteness | Major cities | I00 - I99 Diseases of circulatory system | Age Standardised Rate | 21.6 |
| Remoteness | Inner regional | I00 - I99 Diseases of circulatory system | Crude Rate | 33.8 |
| Remoteness | Inner regional | I00 - I99 Diseases of circulatory system | Age Standardised Rate | 24.7 |
| Remoteness | Outer regional | I00 - I99 Diseases of circulatory system | Crude Rate | 26.6 |
| Remoteness | Outer regional | I00 - I99 Diseases of circulatory system | Age Standardised Rate | 22.5 |
| Remoteness | Remote and very remote | I00 - I99 Diseases of circulatory system | Crude Rate | 29.2 |
| Remoteness | Remote and very remote | I00 - I99 Diseases of circulatory system | Age Standardised Rate | 30.0 |
| Remoteness | Major cities | J00 - J99 Diseases of respiratory system | Crude Rate | 18.2 |
| Remoteness | Major cities | J00 - J99 Diseases of respiratory system | Age Standardised Rate | 17.7 |
| Remoteness | Inner regional | J00 - J99 Diseases of respiratory system | Crude Rate | 20.5 |
| Remoteness | Inner regional | J00 - J99 Diseases of respiratory system | Age Standardised Rate | 18.2 |
| Remoteness | Outer regional | J00 - J99 Diseases of respiratory system | Crude Rate | 19.1 |
| Remoteness | Outer regional | J00 - J99 Diseases of respiratory system | Age Standardised Rate | 17.9 |
| Remoteness | Remote and very remote | J00 - J99 Diseases of respiratory system | Crude Rate | 27.1 |
| Remoteness | Remote and very remote | J00 - J99 Diseases of respiratory system | Age Standardised Rate | 26.4 |
| Remoteness | Major cities | K00 - K93 Diseases of the digestive system | Crude Rate | 49.9 |
| Remoteness | Major cities | K00 - K93 Diseases of the digestive system | Age Standardised Rate | 47.9 |
| Remoteness | Inner regional | K00 - K93 Diseases of the digestive system | Crude Rate | 58.6 |
| Remoteness | Inner regional | K00 - K93 Diseases of the digestive system | Age Standardised Rate | 53.0 |
| Remoteness | Outer regional | K00 - K93 Diseases of the digestive system | Crude Rate | 51.4 |
| Remoteness | Outer regional | K00 - K93 Diseases of the digestive system | Age Standardised Rate | 48.3 |
| Remoteness | Remote and very remote | K00 - K93 Diseases of the digestive system | Crude Rate | 49.1 |
| Remoteness | Remote and very remote | K00 - K93 Diseases of the digestive system | Age Standardised Rate | 50.3 |
| Remoteness | Major cities | L00 - L99 Diseases of skin and subcutaneous tissue | Crude Rate | 7.9 |
| Remoteness | Major cities | L00 - L99 Diseases of skin and subcutaneous tissue | Age Standardised Rate | 7.6 |
| Remoteness | Inner regional | L00 - L99 Diseases of skin and subcutaneous tissue | Crude Rate | 9.9 |
| Remoteness | Inner regional | L00 - L99 Diseases of skin and subcutaneous tissue | Age Standardised Rate | 9.0 |
| Remoteness | Outer regional | L00 - L99 Diseases of skin and subcutaneous tissue | Crude Rate | 10.8 |
| Remoteness | Outer regional | L00 - L99 Diseases of skin and subcutaneous tissue | Age Standardised Rate | 10.3 |
| Remoteness | Remote and very remote | L00 - L99 Diseases of skin and subcutaneous tissue | Crude Rate | 15.4 |
| Remoteness | Remote and very remote | L00 - L99 Diseases of skin and subcutaneous tissue | Age Standardised Rate | 15.9 |
| Remoteness | Major cities | M00 - M99 Diseases of musculoskeletal system and connective tissue | Crude Rate | 32.6 |
| Remoteness | Major cities | M00 - M99 Diseases of musculoskeletal system and connective tissue | Age Standardised Rate | 30.2 |
| Remoteness | Inner regional | M00 - M99 Diseases of musculoskeletal system and connective tissue | Crude Rate | 33.8 |
| Remoteness | Inner regional | M00 - M99 Diseases of musculoskeletal system and connective tissue | Age Standardised Rate | 27.4 |
| Remoteness | Outer regional | M00 - M99 Diseases of musculoskeletal system and connective tissue | Crude Rate | 35.0 |
| Remoteness | Outer regional | M00 - M99 Diseases of musculoskeletal system and connective tissue | Age Standardised Rate | 30.7 |
| Remoteness | Remote and very remote | M00 - M99 Diseases of musculoskeletal system and connective tissue | Crude Rate | 24.1 |
| Remoteness | Remote and very remote | M00 - M99 Diseases of musculoskeletal system and connective tissue | Age Standardised Rate | 24.3 |
| Remoteness | Major cities | N00 - N99 Diseases of the genitourinary system | Crude Rate | 24.6 |
| Remoteness | Major cities | N00 - N99 Diseases of the genitourinary system | Age Standardised Rate | 23.8 |
| Remoteness | Inner regional | N00 - N99 Diseases of the genitourinary system | Crude Rate | 26.5 |
| Remoteness | Inner regional | N00 - N99 Diseases of the genitourinary system | Age Standardised Rate | 24.4 |
| Remoteness | Outer regional | N00 - N99 Diseases of the genitourinary system | Crude Rate | 25.2 |
| Remoteness | Outer regional | N00 - N99 Diseases of the genitourinary system | Age Standardised Rate | 23.8 |
| Remoteness | Remote and very remote | N00 - N99 Diseases of the genitourinary system | Crude Rate | 23.3 |
| Remoteness | Remote and very remote | N00 - N99 Diseases of the genitourinary system | Age Standardised Rate | 24.2 |
| Remoteness | Major cities | O00 - O99 Pregnancy, childbirth and puerperium | Crude Rate | 30.2 |
| Remoteness | Major cities | O00 - O99 Pregnancy, childbirth and puerperium | Age Standardised Rate | 30.2 |
| Remoteness | Inner regional | O00 - O99 Pregnancy, childbirth and puerperium | Crude Rate | 26.0 |
| Remoteness | Inner regional | O00 - O99 Pregnancy, childbirth and puerperium | Age Standardised Rate | 33.5 |
| Remoteness | Outer regional | O00 - O99 Pregnancy, childbirth and puerperium | Crude Rate | 30.5 |
| Remoteness | Outer regional | O00 - O99 Pregnancy, childbirth and puerperium | Age Standardised Rate | 34.6 |
| Remoteness | Remote and very remote | O00 - O99 Pregnancy, childbirth and puerperium | Crude Rate | 32.1 |
| Remoteness | Remote and very remote | O00 - O99 Pregnancy, childbirth and puerperium | Age Standardised Rate | 34.9 |
| Remoteness | Major cities | P00 - P96 Conditions originating in perinatal period | Crude Rate | 3.1 |
| Remoteness | Major cities | P00 - P96 Conditions originating in perinatal period | Age Standardised Rate | 3.4 |
| Remoteness | Inner regional | P00 - P96 Conditions originating in perinatal period | Crude Rate | 3.0 |
| Remoteness | Inner regional | P00 - P96 Conditions originating in perinatal period | Age Standardised Rate | 3.4 |
| Remoteness | Outer regional | P00 - P96 Conditions originating in perinatal period | Crude Rate | 2.8 |
| Remoteness | Outer regional | P00 - P96 Conditions originating in perinatal period | Age Standardised Rate | 3.0 |
| Remoteness | Remote and very remote | P00 - P96 Conditions originating in perinatal period | Crude Rate | 3.8 |
| Remoteness | Remote and very remote | P00 - P96 Conditions originating in perinatal period | Age Standardised Rate | 3.1 |
| Remoteness | Major cities | Q00 - Q99 Congenital anomalies | Crude Rate | 1.7 |
| Remoteness | Major cities | Q00 - Q99 Congenital anomalies | Age Standardised Rate | 1.8 |
| Remoteness | Inner regional | Q00 - Q99 Congenital anomalies | Crude Rate | 1.6 |
| Remoteness | Inner regional | Q00 - Q99 Congenital anomalies | Age Standardised Rate | 1.8 |
| Remoteness | Outer regional | Q00 - Q99 Congenital anomalies | Crude Rate | 1.7 |
| Remoteness | Outer regional | Q00 - Q99 Congenital anomalies | Age Standardised Rate | 1.8 |
| Remoteness | Remote and very remote | Q00 - Q99 Congenital anomalies | Crude Rate | 1.9 |
| Remoteness | Remote and very remote | Q00 - Q99 Congenital anomalies | Age Standardised Rate | 1.7 |
| Remoteness | Major cities | R00 - R99 Symptoms, signs and abnormal findings | Crude Rate | 48.3 |
| Remoteness | Major cities | R00 - R99 Symptoms, signs and abnormal findings | Age Standardised Rate | 45.7 |
| Remoteness | Inner regional | R00 - R99 Symptoms, signs and abnormal findings | Crude Rate | 51.8 |
| Remoteness | Inner regional | R00 - R99 Symptoms, signs and abnormal findings | Age Standardised Rate | 45.2 |
| Remoteness | Outer regional | R00 - R99 Symptoms, signs and abnormal findings | Crude Rate | 44.3 |
| Remoteness | Outer regional | R00 - R99 Symptoms, signs and abnormal findings | Age Standardised Rate | 40.7 |
| Remoteness | Remote and very remote | R00 - R99 Symptoms, signs and abnormal findings | Crude Rate | 45.3 |
| Remoteness | Remote and very remote | R00 - R99 Symptoms, signs and abnormal findings | Age Standardised Rate | 46.2 |
| Remoteness | Major cities | S00 - T98 Injury poisoning and other external causes | Crude Rate | 37.7 |
| Remoteness | Major cities | S00 - T98 Injury poisoning and other external causes | Age Standardised Rate | 36.1 |
| Remoteness | Inner regional | S00 - T98 Injury poisoning and other external causes | Crude Rate | 42.2 |
| Remoteness | Inner regional | S00 - T98 Injury poisoning and other external causes | Age Standardised Rate | 39.0 |
| Remoteness | Outer regional | S00 - T98 Injury poisoning and other external causes | Crude Rate | 42.2 |
| Remoteness | Outer regional | S00 - T98 Injury poisoning and other external causes | Age Standardised Rate | 40.7 |
| Remoteness | Remote and very remote | S00 - T98 Injury poisoning and other external causes | Crude Rate | 56.1 |
| Remoteness | Remote and very remote | S00 - T98 Injury poisoning and other external causes | Age Standardised Rate | 58.7 |
| Remoteness | Major cities | Z00 - Z99 Factors influencing health status and contact with health services | Crude Rate | 121.7 |
| Remoteness | Major cities | Z00 - Z99 Factors influencing health status and contact with health services | Age Standardised Rate | 111.4 |
| Remoteness | Inner regional | Z00 - Z99 Factors influencing health status and contact with health services | Crude Rate | 134.4 |
| Remoteness | Inner regional | Z00 - Z99 Factors influencing health status and contact with health services | Age Standardised Rate | 105.9 |
| Remoteness | Outer regional | Z00 - Z99 Factors influencing health status and contact with health services | Crude Rate | 159.4 |
| Remoteness | Outer regional | Z00 - Z99 Factors influencing health status and contact with health services | Age Standardised Rate | 136.8 |
| Remoteness | Remote and very remote | Z00 - Z99 Factors influencing health status and contact with health services | Crude Rate | 205.4 |
| Remoteness | Remote and very remote | Z00 - Z99 Factors influencing health status and contact with health services | Age Standardised Rate | 199.1 |
Additional information
Data and statistics
More information about Queensland hospitalisations is available from the Queensland Health performance and Statistical Services Branch.
National health statistics are available on the AIHW Admitted patients and Australia’s hospital at glance websites.
Section technical notes
- Where presented, ratios were calculated using higher precision estimates than those that are displayed within the report.
- The ICD coding system is maintained by the World Health Organization and provides internationally comparable mortality and morbidity statistics over time and between regions. In Australia, the ICD-10 was adapted for the Australian context from the WHO ICD system. The ICD-10-AM is now maintained by the Independent Health and Aged Care Pricing Authority (IHACPA).5
- Multiple factors may cause a person’s hospital admission. The principal diagnosis is the one deemed chiefly responsible for the admission.
- Data reported in this section were sourced from the Queensland Hospital Admitted Patient Data Collection (QHAPDC). Individual records in the QHAPDC are episode based, meaning that multiple episodes from the same person will be counted multiple times in a reporting period.
- Separations from interstate residents, public psychiatric hospitals and those flagged as unqualified newborns, organ donors or boarders are excluded. Records from 47 previously declared hospitals are excluded.
- Unless otherwise stated, age-standardised rates were calculated by standardising to 2001 Australian standard population.
References
- Queensland Health. 2023. Queensland Hospital Admitted Patient Data Collection (QHAPDC). Accessed: 12 November 2022.
- Independent Health and Aged Care Pricing Authority. 2022. ICD-10-AM/ACHI/ACS. Accessed: 4 November 2022.
- Queensland Health. 2011. Impact of changes in diabetes coding on Queensland hospital principal diagnosis morbidity data. Accessed: 11 November 2022.
- Queensland Health. 2015. Recent growth in public hospital separations – more than meets the eye?. Accessed: 4 November 2022.
- Queensland Health. 2018. Impact of changes to coding of rehabilitation episodes of care. Accessed: 4 November 2022.
- Queensland Health. 2018. Impact of changes to coding palliative care. Accessed: 4 November 2022.
- Queensland Health. 2018. Rehabilitation episodes of care: Top 10 principal diagnosis codes 2014/2015 to 2016/2017. Accessed: 4 November 2022.